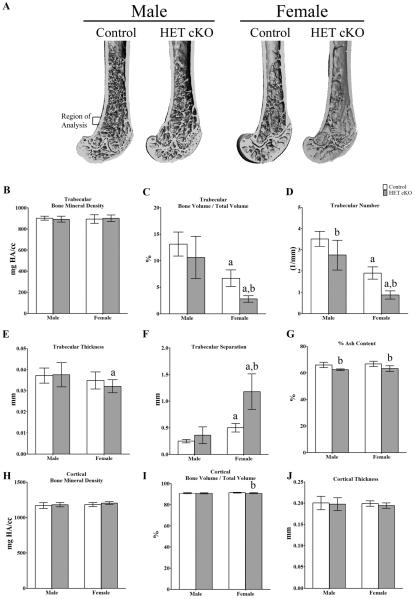
Figure 1.
Bone phenotype of control and HET cKO femurs. A) Representative 3D μCT images of femoral trabecular bone. Ex-vivo high-resolution analyses of distal femurs to determine B) trabecular Bone Mineral Density (BMD), C) trabecular bone volume / total volume (BV/TV) D) trabecular number, E) trabecular thickness, F) trabecular separation G) percentage ash content. H) Cortical BMD, I) cortical BV / TV and J) cortical thickness in control (white bars) and HET cKO mice (gray bars). (B–G) Bar graphs represent means plus SD. Group size n=7 for male and female controls and male HET cKO mice; n=9 for HET cKO mice. Statistical comparisons; a: p<0.05 between male and female of same genotype b: p<0.05 comparing control to HET cKO.

