
Figure 3.
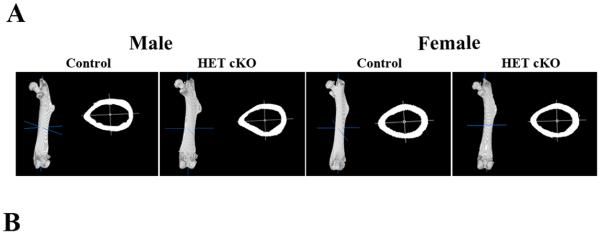
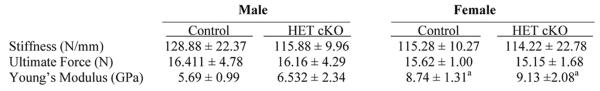
Biomechanical properties of control femurs as compared to HET cKO. A) Representative 3D images of entire femur and cortical cross section using the BoneJ plug-in (ImageJ). B) Table listing the biomechanical parameters: Stiffness, Ultimate Force and Young's Modulus. Group size n=8 for male controls and HET cKO; n=6 for and female controls; n=10 for female HET cKO mice. Statistical comparisons; a: p<0.05 between male and female of same genotype.