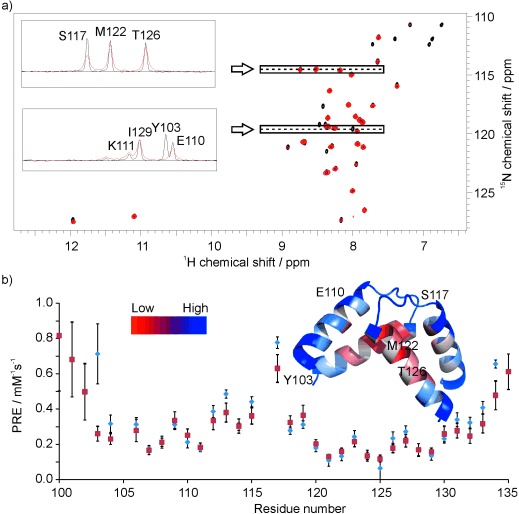
Figure 4.

a) 1H–15N HSQC of the Qua1 domain from the Sam68 protein in the presence of 0 (black) and 10 mm Gd(DTPA-BMA) (red), 1D traces of selected resonances are shown in the inset; NMR spectra were recorded at 600 MHz and 298 K, with 2048×200 points, 8 scans and a 15N dimension spectral width set to δ=20 ppm and centred at δ=119 ppm. b) Observed (blue circles) and back-calculated (red squares) PRE values per residue and their mapping on the Qua1 structure (red=low PRE, blue=high PRE). Selected amide resonance traces from a) are mapped on the structure. sPREs were obtained from the 1H R1 values measured by using a saturation-recovery scheme preceding a 1H–15N HSQC-based detection block (recovery times between 0.01 and 4.0 s) at concentrations of 0, 1, 2, 3, 4, 5, 7 and 10 mm of the soluble paramagnetic agent Gd(DTPA-BMA). Back-calculation and data analysis was carried out according to the procedure reported by Madl et al.[4b]
