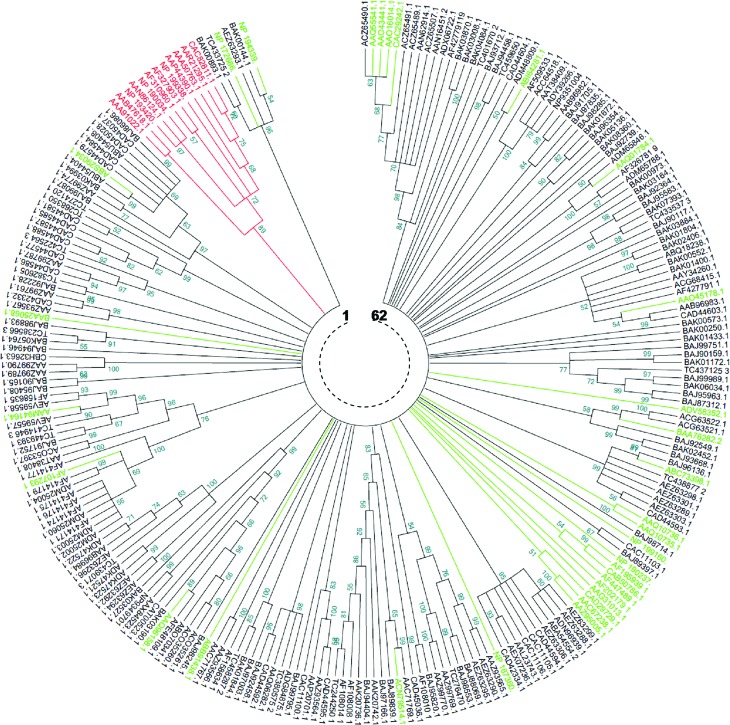
Figure 3.
Neighbor-Joining phylogenetic comparison of Triticeae and non Triticeae NBS-encoding genes and RGAs. The numbers on the branches indicate the percentage of 1000 bootstrap replicates that support the node with only values > 50% reported. The evolutionary distances were computed using the Dayhoff matrix based method (Schwarz and Dayhoff, 1979). The rate variation among sites was modelled with a gamma distribution (shape parameter = 8). All positions containing gaps and missing data were eliminated. The analysis involved 243 amino acid sequences (in red: reference TNLs, in green: reference CNLs, in black: 199 core NBS representing the diversity of NBS-encoding RGAs in Triticeae). 62 clades are shown and TIR-NBS taxa are distinguished from CC-NBS ones.

