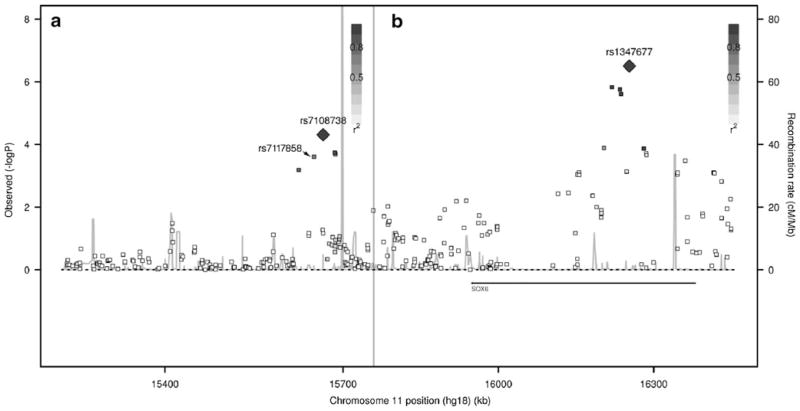
Fig. 1.
Regional association plot for SOX6 on chromosome 11. In the left of grey line (a), r2 of pairwise LD is calculated between rs7108738 and other SNPs in the left of grey line. In the right of grey line (b), r2 of pairwise LD is calculated between rs1347677 and other SNPs in the right of grey line. There is no LD between rs7108738 and rs1347677

