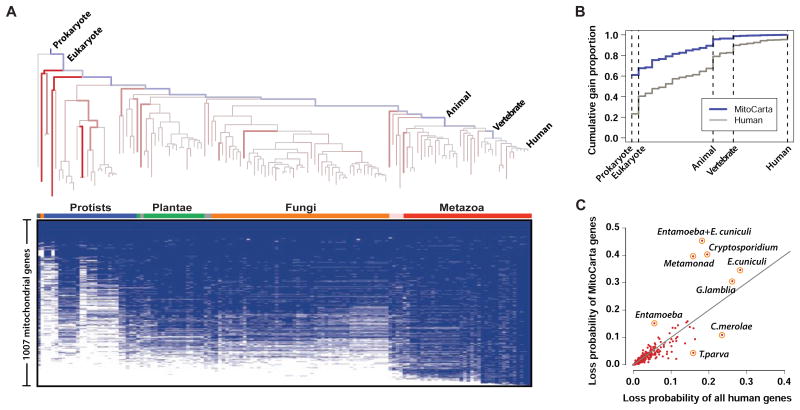
Figure 6. CLIME analysis of the mitochondrial proteome.
(A) CLIME's estimates of proportions of gene gain (blue branches) and average branch-specific probabilities of gene loss (red branches) on the 138 eukaryotic species tree for the 1007 human mitochondrial genes. Brighter hue indicates higher probability. The presence/absence of the 1007 human mitochondrial genes across 138 species is shown in blue/white matrix.
(B) Cumulative gain proportions of mitochondrial genes versus all human genes (only selected branches labeled).
(C) Average loss probability of mitochondrial genes versus all human genes for each tree branch (only selected branches labeled).

