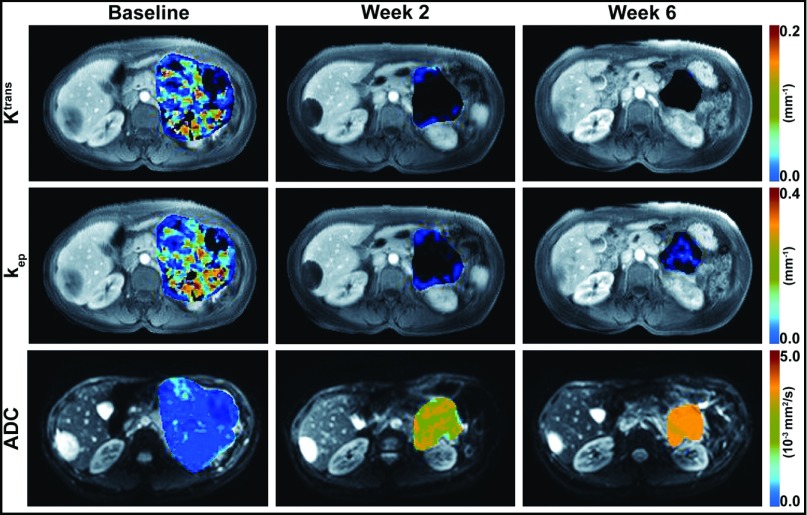
Figure 2.
DW/DCE-MR images with physiological parametric maps of a GIST in a 48-year-old woman. Motion-corrected DCE-MR images at 30 seconds after gadoteridol injection with superimposed tumor Ktrans (first row) and kep (second row) maps before (baseline) and at 2 and 6 weeks after initiation of sunitinib therapy. DW images obtained with a b value of 0 s/mm2, with superimposed tumor ADC maps (third row) before (baseline) and at 2 and 6 weeks after initiation of sunitinib therapy. The same color scale was applied for the 3 maps in each row.

