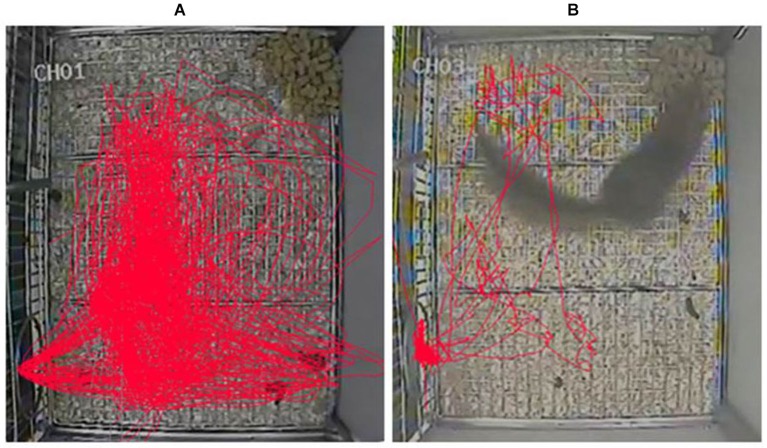
Figure 6.
Representative tracks of movements in tree shrews 30–60 min after the injection of 10 mg/kg morphine or saline. (A) The tracing of a tree shrew’s movements 30–60 min after the injection of 10 mg/kg morphine. (B) The tracing of another tree shrew’s movements 30–60 min after the injection of saline (2 ml/kg).

