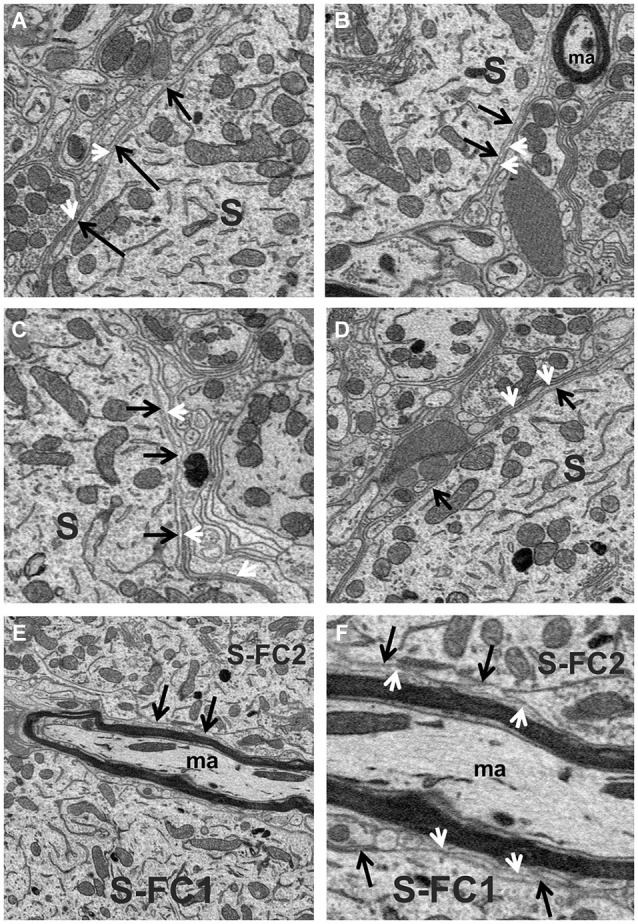
Figure 3.

(A–D) High magnification view of the fusiform cell plasmalemma (black arrows) showing the thin astrocytic lining (white arrowheads) that ensheathed much of the soma (S) surface. (E,F) Different magnifications of the surfaces (black arrows) of two fusiform cell somata (S-FC1 and S-FC2) that were very closely associated. Note the band of myelinated axons (ma) that runs between these cells was separated from the somal surface by astrocytic processes (white arrowheads).
