Figure 9.
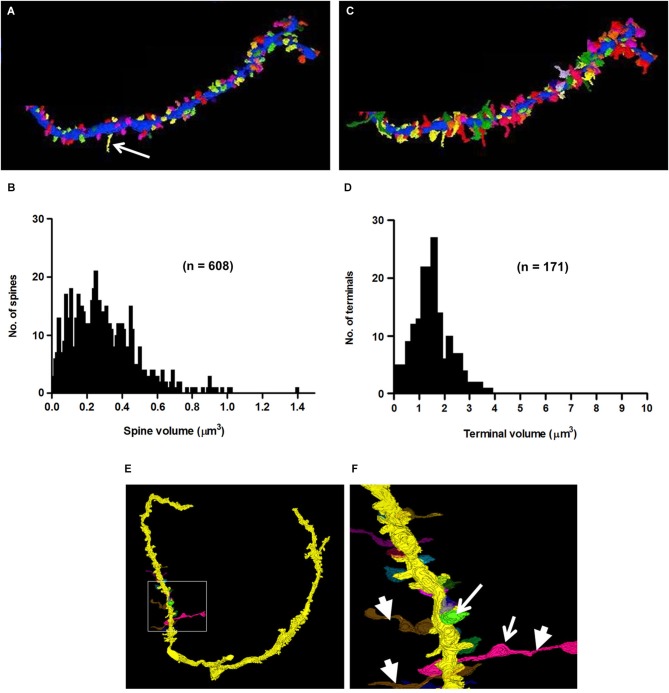
3D-reconstructions and metrics of spines and axo-spinous terminals of a secondary branch of an apical dendrite. (A) Cartography of spines, represented in different colors. Arrow points to a filopodium. (B) Histogram showing the probability distribution of spines of different volumes. (C) Reconstruction of synaptic terminals, (different colors) ending on spines shown in panel A. (D) Probability distribution of terminals of different sizes on dendritic spines (compare with Figure 5G). Note that the short stretches of axon beyond the terminal shown in panel (C) were not included in the measures of terminal volume (see Section Methods). (E–F) 3D-reconstructions of axons showing their en passant swellings (arrows) and horizontal trajectories (arrowheads) consistent with their identities as parallel fibers.

