FIGURE 4.
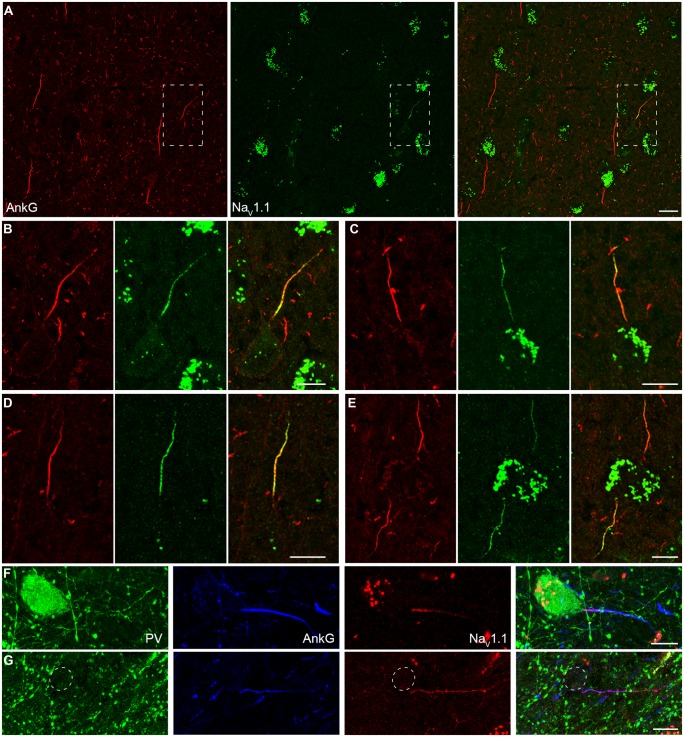
Distribution of NaV1.1 at the AIS of interneurons in L2–L6. (A) Double staining of AnkG (red) and NaV1.1 (green) showed that positive stainings of NaV1.1 were only found in the thin AIS of a putative interneuron (boxed area). Note that the orientation and thickness of the AIS were different from those of putative PCs. (B) High magnification of the boxed area shown in A. NaV1.1 immunosignals were more concentrated at the proximal AIS. (C–E) Other examples of NaV1.1 stainings at the AIS of interneurons. The distribution pattern and the relative fluorescence intensity varied across interneurons. Note that the two AIS in E showed different fluorescence intensity. (F–G) Triple staining of PV (green), AnkG (blue), and NaV1.1 (red). (F) NaV1.1 immunosignals accumulated at the AIS of the PV-positive neuron, especially at the very proximal AIS region. (G) In a putative interneuron (PV-negative), NaV1.1 signals could be also found at the AIS, but distributed evenly. Note the axon trunk beyond the AIS was also stained. Pia locates to the top in (A–E), and to the left in (F,G). Thickness of the Z-stacks is 3.5 μm in (A), 3 μm in (B,D,E), 1 μm in (C), 5 μm in (F), 8 μm in (G). Scale bars represent 20 μm in (A), 10 μm in (B–G).

