
Figure 4.
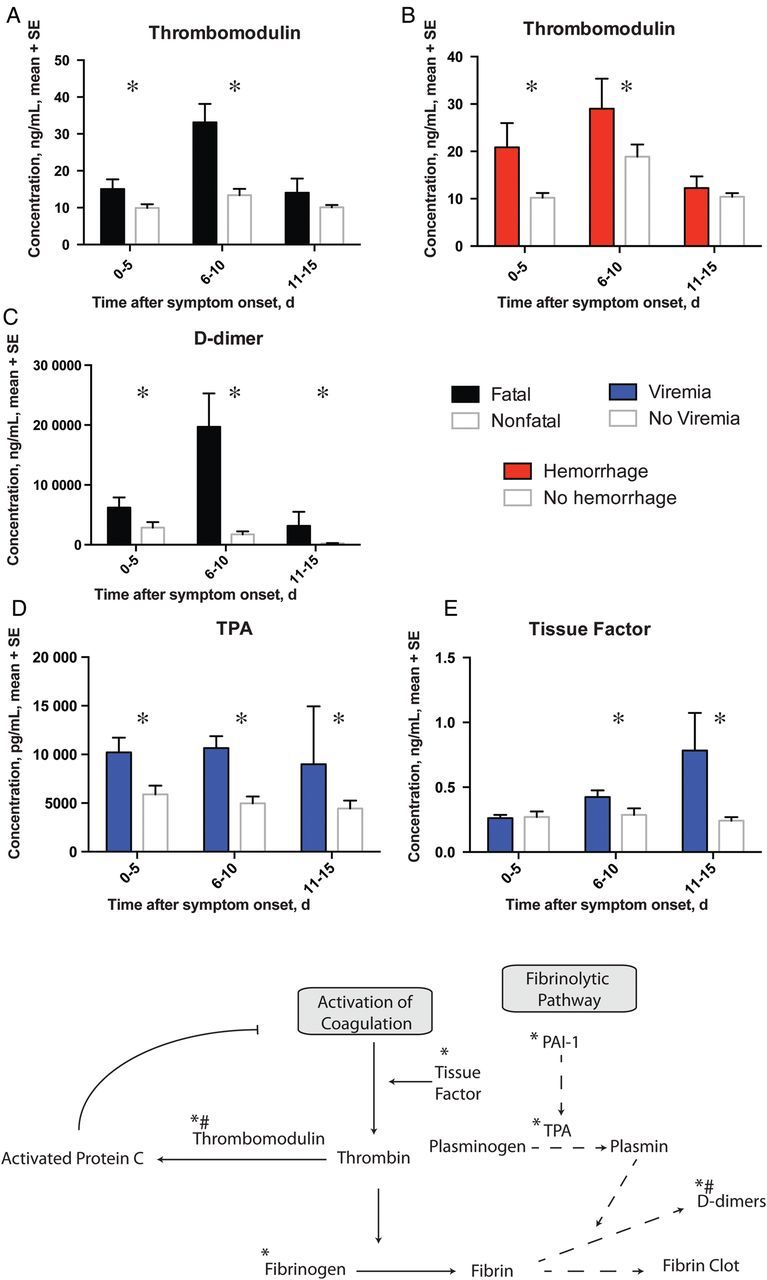
Markers of coagulation and fibrinolytic pathways associated with a fatal outcome (black bars), hemorrhagic manifestations (red bars) or viremia (blue bars). *P ≤ .05. A simplified model of the coagulation/fibrinolytic pathway is also depicted. Proteins that are known to play a major role in the pathways are noted. Arrows indicate activation while bars indicate inhibition. *, analytes assessed in the study; #, analytes associated with death.