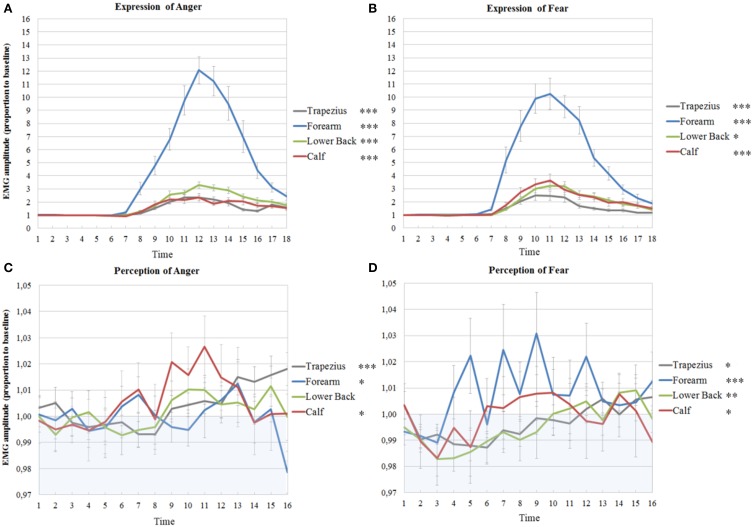
Figure 4.
Muscle activations in experiment 1 and 2 on the left side of the body. EMG amplitudes and standard errors of the mean of muscles on the left during active imitation of anger (A) and fear (B) and during passive viewing of anger (C) and fear (D). The first six time points represent EMG activity during stimulus presentation. Activity below one (in blue area) indicates deactivation as compared to baseline. Significance levels of the fixed effect of time; ***p < 0.001, **p < 0.01, *p < 0.05.

