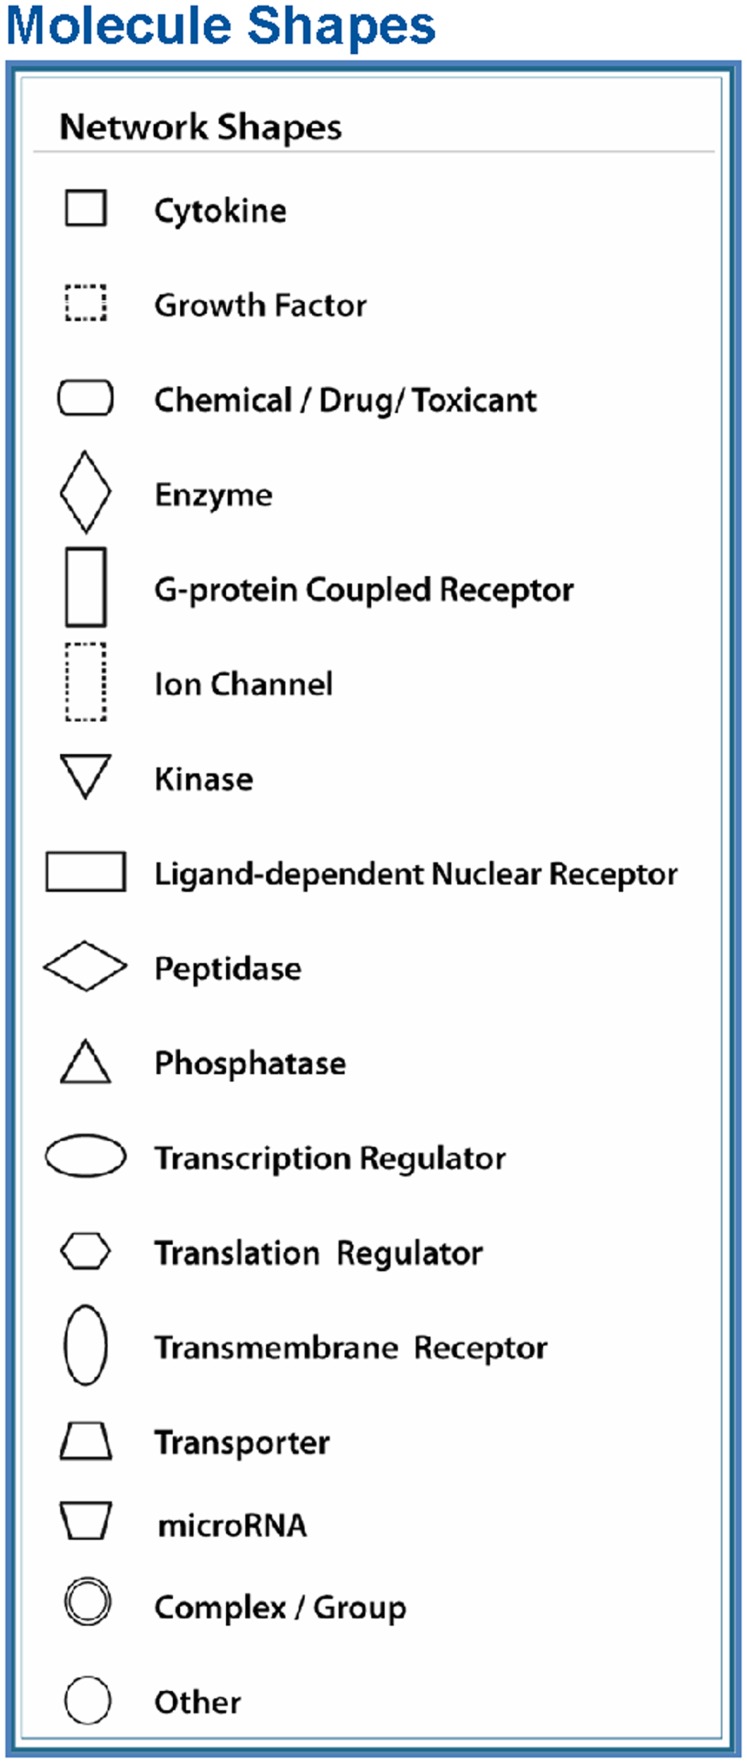
Figure 4.
Node (gene) and edge (gene relationship) symbols are described in the figure. The intensity of the node color-(red) indicates the degree of upregulation. Genes in uncolored nodes are not identified as differentially expressed genes in our experiment and are integrated into the computationally generated networks on the basis of the evidence stored in the IPA knowledge memory indicating a relevance to this network. The node shapes denote enzymes, phosphatases, kinases, peptidases, G-protein-coupled receptors, transmembrane receptors, cytokines, growth factors, ion channels, transporters, translation factors, nuclear receptors, and transcription factors.

