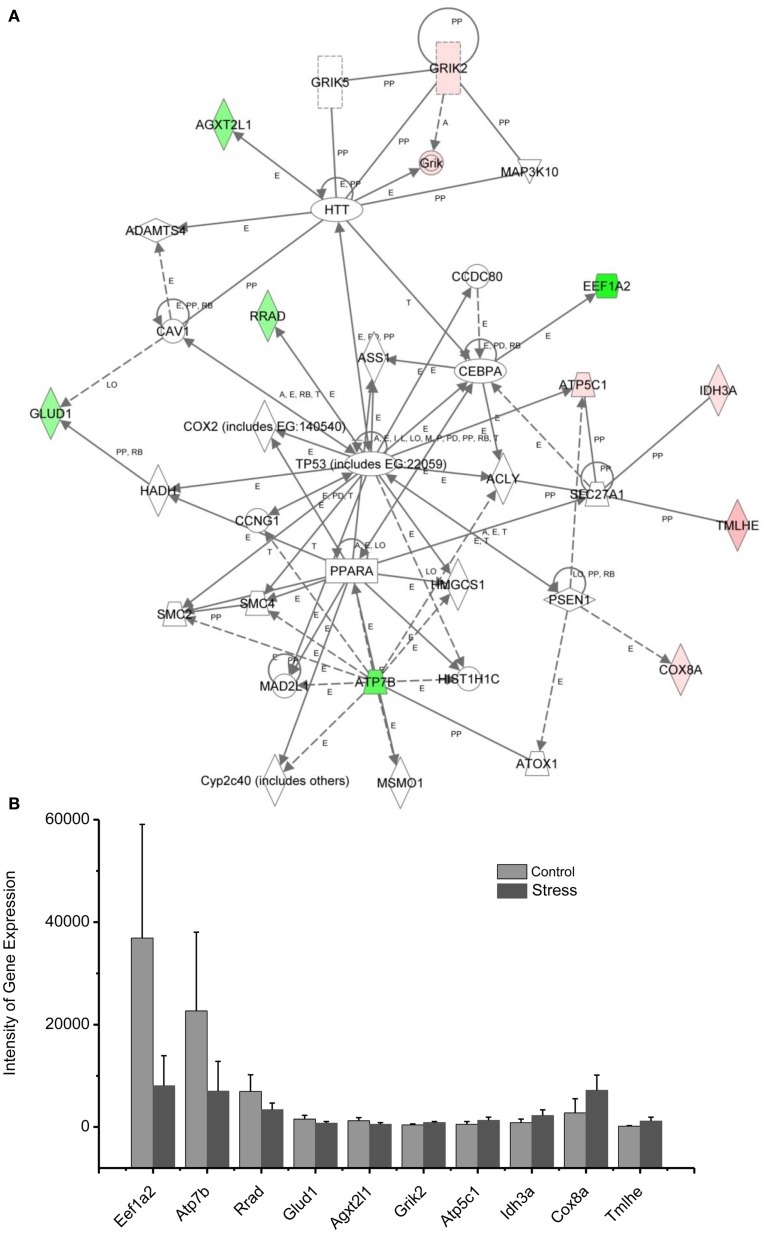
Figure 5.
In (A), IPA associates stress up- or downregulated mitochondrial-related genes with the network containing TP53, PPARA, and HTT. (B) is a bar graph plotted with mean ± SD of the intensity of up- or downregulated genes for the stressed (n = 10) and control amygdala (p < 0.01, n = 10) in the network associated with TP53, PPARA, and HTT in the amygdala 14 days after stress. The order is plotted according to fold change, from downregulated with lowest negative value to upregulated with highest positive value.

