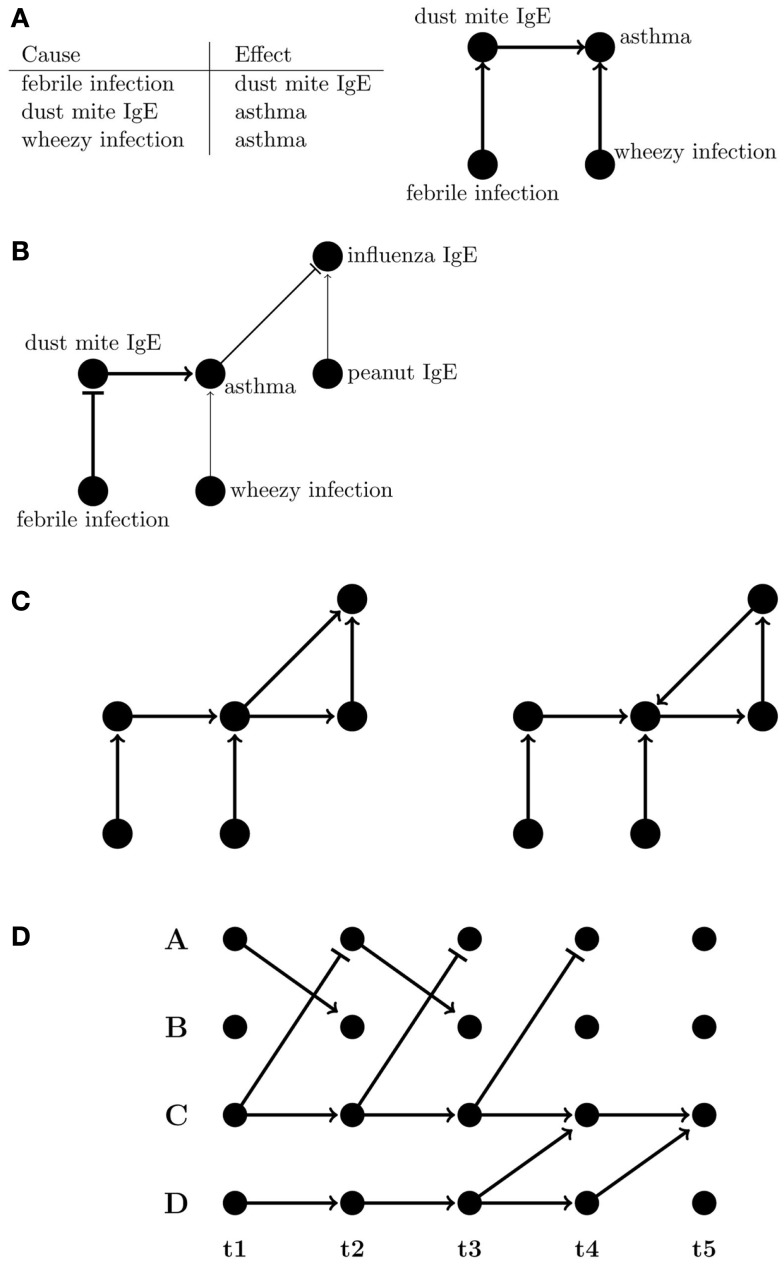
Figure 3.
Representations of directed networks. (A) Tabular and graphical (left and right, respectively) displays of directional flow between variables. (B) Graph showing variations in strength and sign of effects between variables. The flattened edges indicate negative relationships. (C) Directed acyclic (DAG) and directed cyclic graphs (left and right, respectively). (D) A dynamic Bayesian network where edges are only between subsequent time points.

