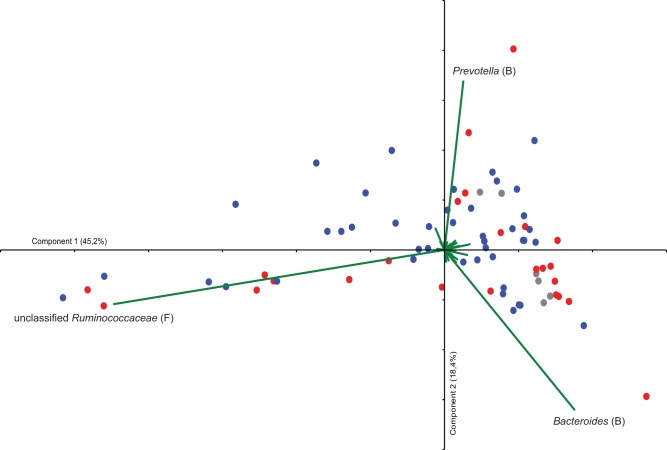
FIG 1 .
Bi-plot from a principal-component analysis (PCA) of 454 pyrosequencing data classified to the taxon level. Each sample obtained from the poultry abattoir workers is represented by a colored circle, and the variables are shown as green vectors. Eigenvalues for components 1 and 2 are shown in parentheses. The colors of samples represent different groups, as follows: red, individuals who became Campylobacter positive; blue, individuals who remained Campylobacter negative; and gray, individuals with earlier reported Campylobacter infection. Abbreviations represent the phylogenetic origins of the different taxa, as follows: B, Bacteroidetes, and F, Firmicutes.

