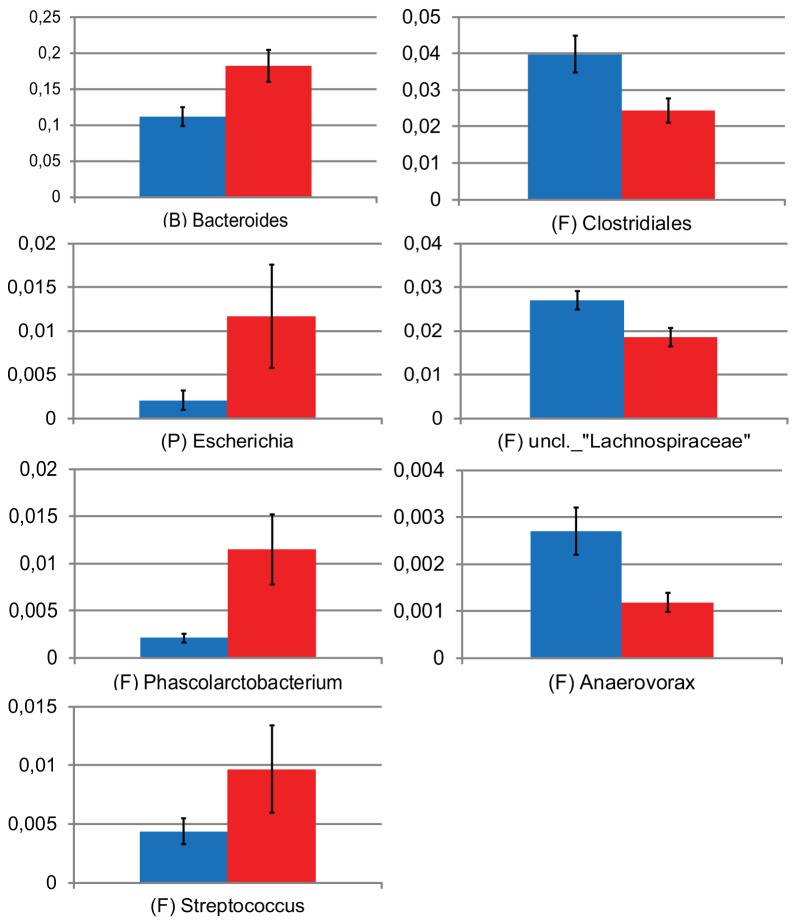
FIG 2 .
Relative abundances of taxa that differ significantly between individuals who became Campylobacter positive (red) and those who remained negative (blue) (Mann-Whitney’s test). Error bars show standard errors of the means. Abbreviations represent the phylogenetic origin of the different taxa as follows: B, Bacteroidetes; F, Firmicutes; and P, Proteobacteria. uncl., unclassified.

