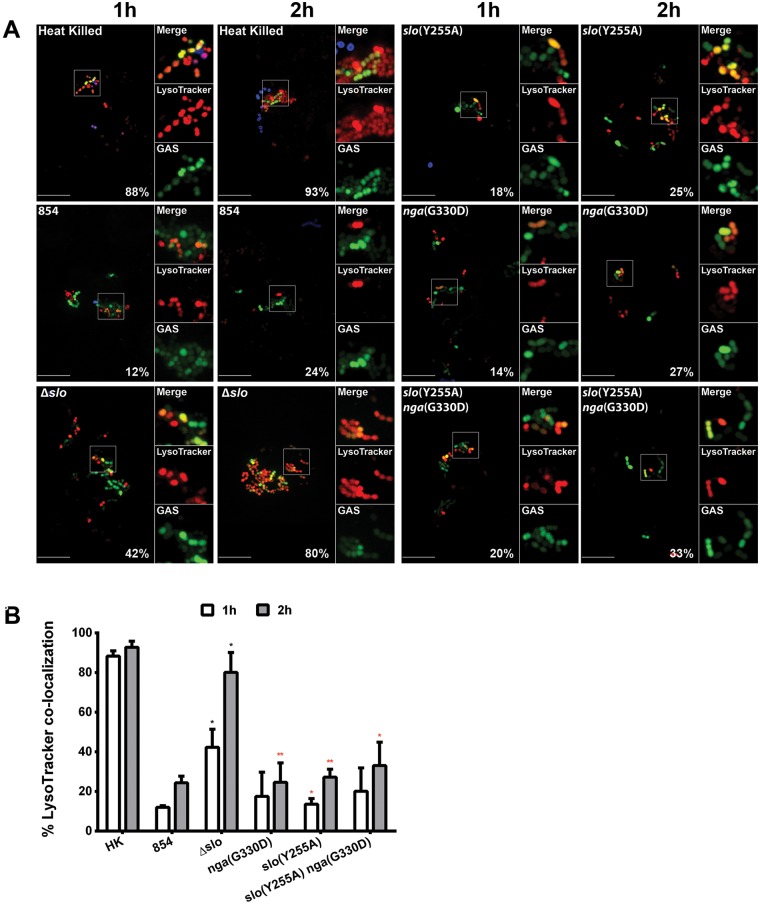
FIG 4 .
SLO impairs acidification of GAS-containing phagolysosomes. (A) Confocal microscopy images demonstrating the association between the acidotropic probe LysoTracker Red DND-99 (red) and GFP-expressing GAS (green) at 1 and 2 h of infection. Extracellular GAS bacteria are also stained blue (Alexa 660). Representative images from one experiment are shown. Scale bars = 10 µm. The percentage of intracellular bacteria of each strain that colocalized with LysoTracker is shown. (B) Percentage of heat-killed (HK) or live GAS colocalized with LysoTracker at 1 h (white bars) or 2 h (gray bars) of infection. Mean values ± the standard errors of at least three independent experiments are shown. Black asterisks indicate values that differ significantly from that for strain 854; red asterisks indicates values that differ significantly from that for the Δslo mutant. *, P < 0.05; **, P < 0.01.

