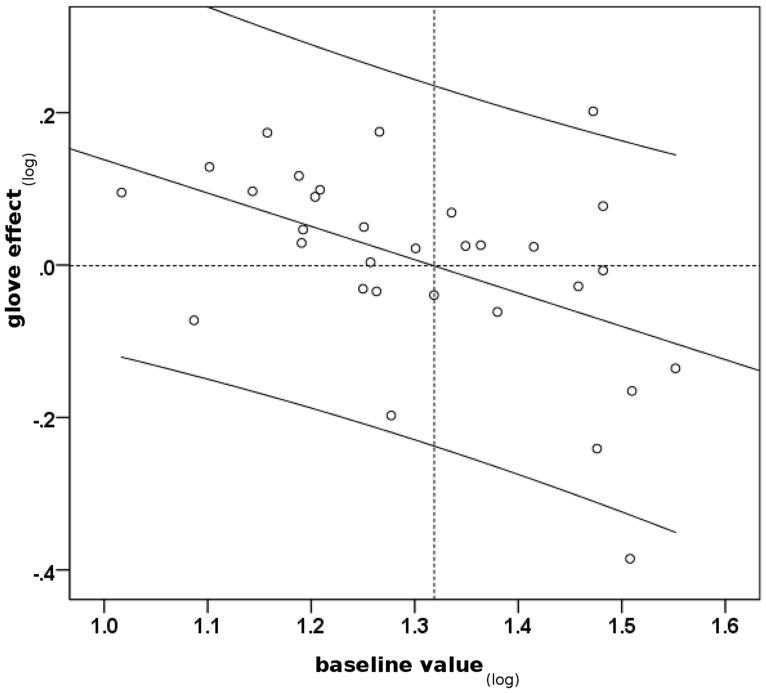
FIGURE 1.
Scatterplot indicating an association between severity of dystonia at the time of baseline test and change of performance through the glove-effect. Baseline value(log): log medSD-IOIbaseline, high values indicate severely impaired motor control. Glove-effect(log): log medSD-IOIglove – log medSD-IOIbaseline, negative values indicate improvement through glove and vice versa. Pearson’s r = -0.45; p = 0.01, two-tailed. Black line: regression line. Curved lines: 95% confidence interval.

