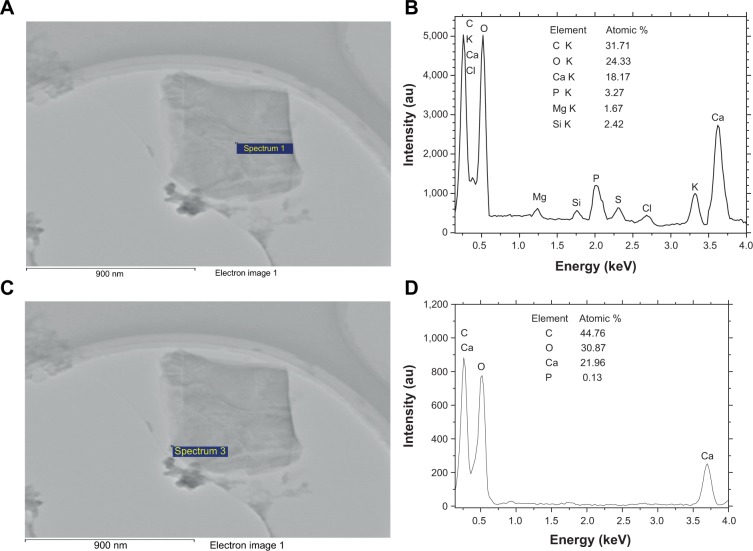
Figure 7.
Energy dispersive X-ray spectroscopy analysis of the elemental distribution of urinary crystallite of a representative calcium oxalate stone patient.
Notes: (A, C) High-resolution transmission electron microscopy images; (B, D) element distribution, in which (A, B) show the central part, and (C, D) show the outside part of urinary crystallites.

