Figure 5.

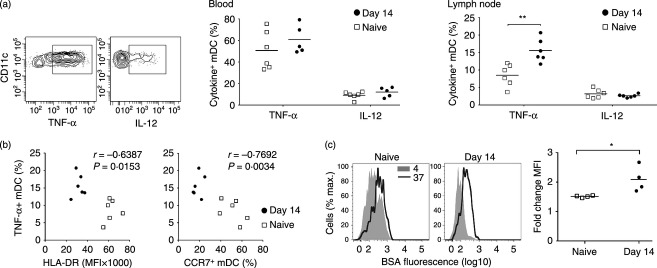
Increased cytokine production and antigen processing in lymph node myeloid dendritic cells (mDC) during acute simian immunodeficiency virus (SIV) infection (a) Left: Representative flow cytometry plots showing labelling of stimulated blood mDC with antibodies to tumour necrosis factor-α (TNF-α) and interleukin-12 (IL-12). Right: Percentage of mDC expressing TNF-α or IL-12 following stimulation with the Toll-like receptor 7/8 (TLR7/8) agonist 3M-007 in blood and lymph node from SIV-naive macaques and macaques at 14 days after SIV infection. Symbols represent individual animals and horizontal bars represent means. (b) Correlation between TNF-α production and HLA-DR and CCR7 expression on mDC in lymph nodes of SIV naive macaques and macaques at 14 days after SIV infection. (c) Left: Representative histograms of BSA fluorescence in stimulated lymph node mDC after 30 min incubation with DQ Green BSA at 4° and 37°. Right: Fold change in BSA fluorescence of mDC incubated with DQ Green BSA at 37° relative to 4° in SIV naive macaques and macaques at 14 days after SIV infection. Symbols represent individual animals and horizontal bars represent means. *P < 0·05, **P < 0·01 by Mann–Whitney U-test.
