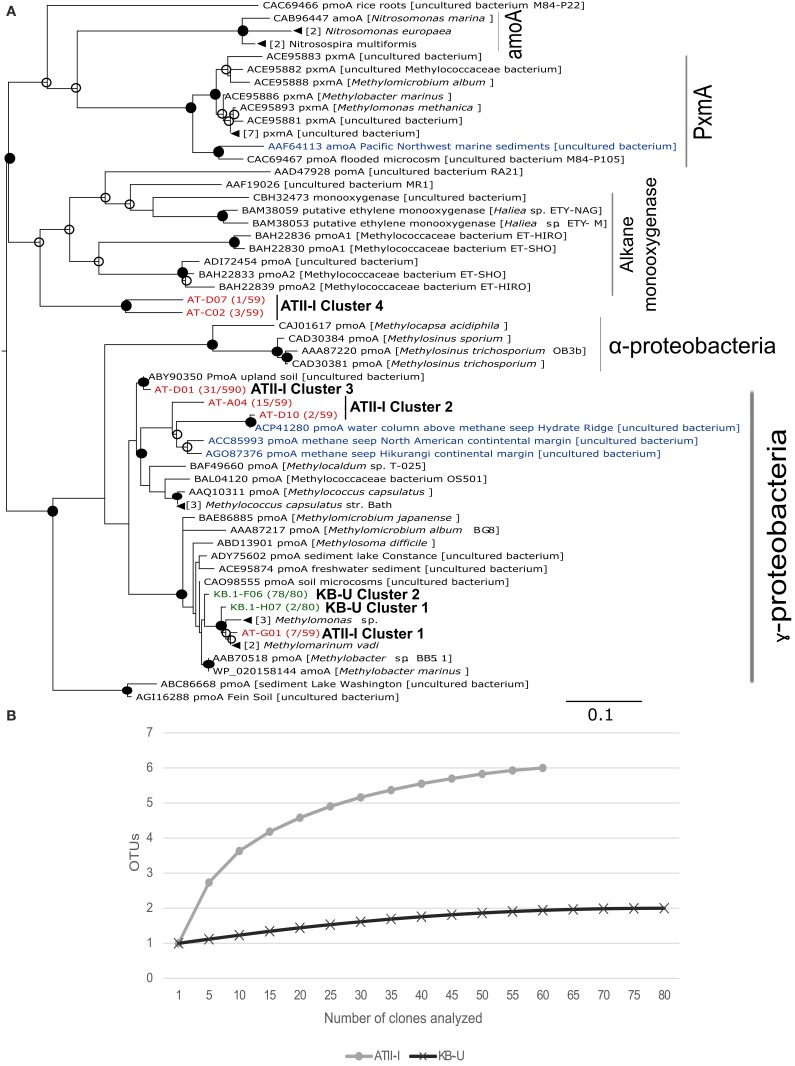
Figure 4.
pmoA phylogenetic tree and species richness of aerobic methanotrophs. (A) Deduced amino acid phylogeny of predicted pmoA sequences amplified from ATII-I (6 OTUs-red) and KB-U (2 OTUs-green) based on 90% nucleotide sequence identity. The Red Sea brine pool OTUs were compared with deduced amino acid sequences for pmoA derived from other marine environments (blue), soil and cultured methanotrophs. The number between parentheses, following the sequence name, represents the number of sequences within the library that belong to the represented OTUs. The tree was generated using 168 aa. The numbers of sequences collapsed in the selected node are indicated adjacent to the sample name. The tree was calculated using the maximum-likelihood approach with 100 bootstrap replicates. Percentages greater than 50% of bootstrap resampling are indicated with an open circle and those greater than 70% with a closed circle near the nodes. The scale bar represents 10% estimated sequence divergence. (B) Species richness in the Atlantis II Deep and Kebrit Deep brine-seawater interphase layers based on pmoA clone library rarefaction curve analysis. Phylotypes were generated based on a distance threshold of 0.1.

