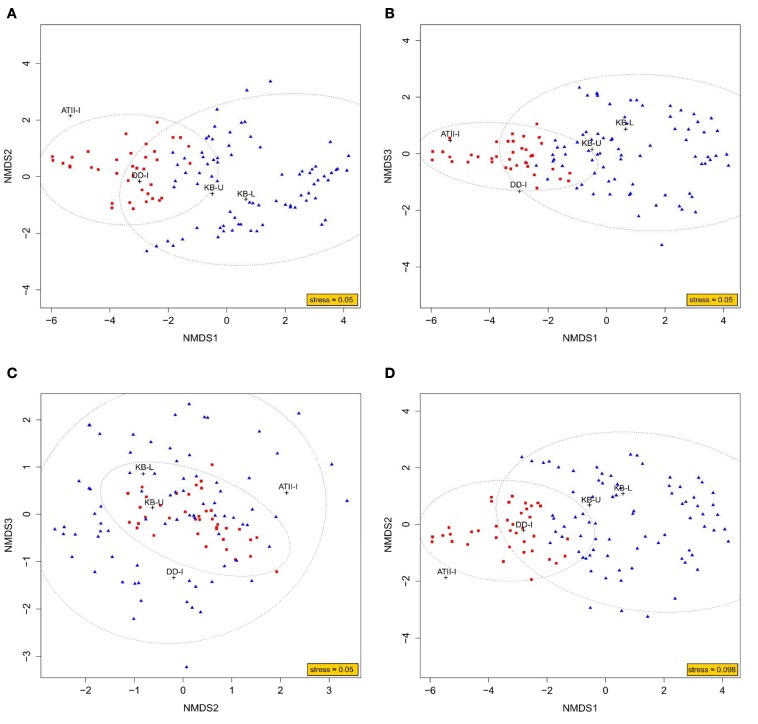
Figure 5.
NMDS ordination plot based on KEGG mapping to methane metabolism pathways. Representation of the NMDS analysis in 3D (A–C) and 2D (D). The analysis considers each dataset of reads obtained through Red Sea interface shotgun pyrosequencing as a variable. The read counts recruited to methane metabolism-related KEGG orthologous groups were considered as an observation. The ordination of observations is represented by either blue triangles (cluster 1) or red squares (cluster 2). While the black crosses represent the ordination of variables, which is deduced from the weighted average of their respective observations. An ellipse around the centroid of each cluster depicts 95% confidence in the assignment of observations to the cluster.

