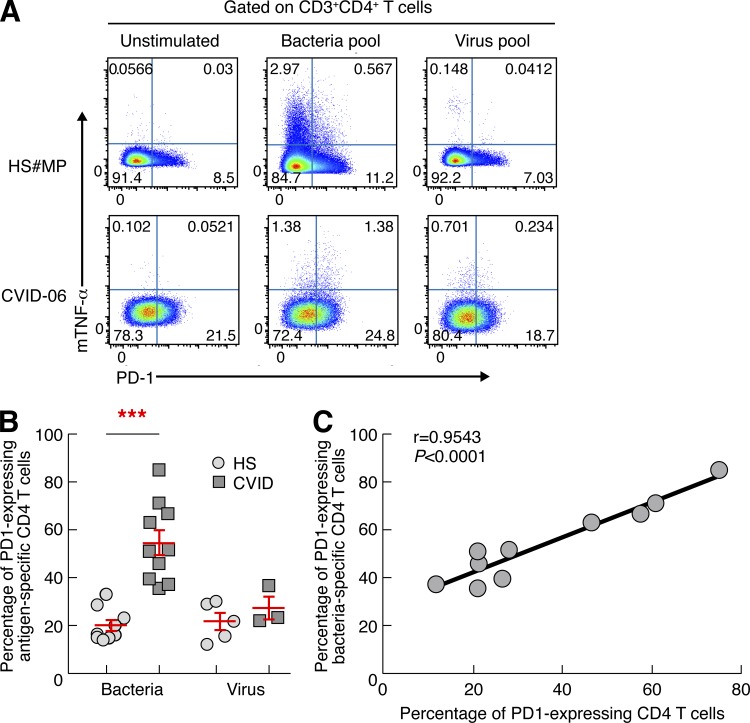
Figure 4.
Bacteria-specific CD4 T cells of CVID patients express high levels of PD-1. Percentages of bacteria-specific and virus-specific CD4 T cells expressing PD-1 were analyzed by flow cytometry. (A) Representative flow plots from one healthy subject (#MP) and one CVID patient (CVID-06). (B) Proportion of antigen-specific CD4 T cells expressing PD-1 in healthy subjects (n = 9) and CVID patients (n = 10). (C) Correlation between the percentage of PD-1–expressing total CD4 T cells and the percentage of PD-1–expressing bacteria-specific CD4 T cells. Statistical significance (p-values) in B were calculated using Student’s t test and in C using Spearman’s rank correlations. ***, P < 0.0001.

