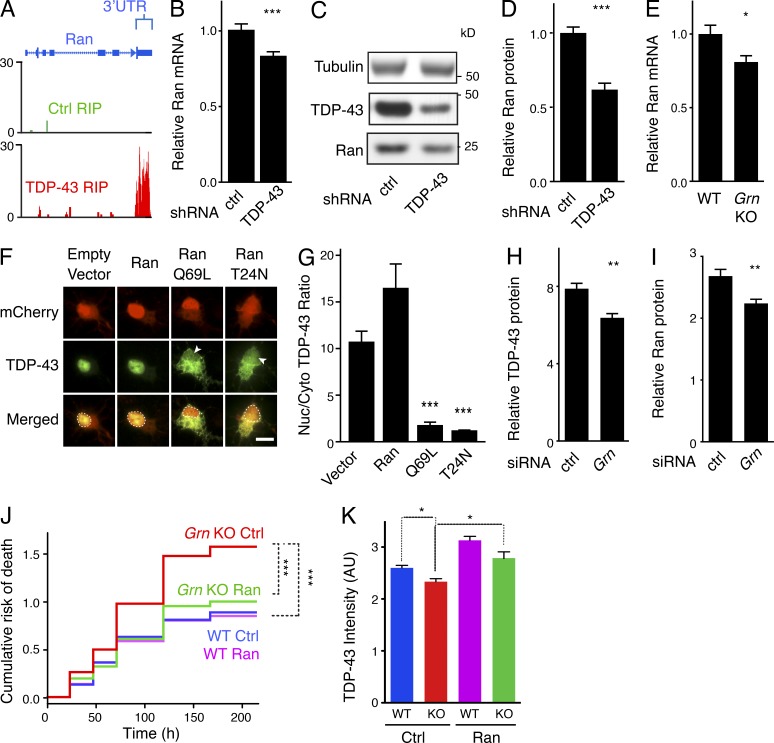
Figure 4.
Maintenance of functional TDP-43 and Ran by an interdependent feedback loop and improved survival of Grn-KO neurons by exogenous Ran expression. (A) Snapshot of unique reads from the TDP-43 RIP library mapped to the Ran gene shown. Reads mapped to the 3′-UTR of Ran indicate TDP-43 binding. No reads mapped to the Ran gene from the Ctrl RIP library. (B) TDP-43 knockdown in N2A cells results in a reduction in steady-state Ran mRNA levels, as measured by Q-PCR. n = 12 wells/group; ***, P < 0.001, Student’s t test; 3 independent experiments. (C) Representative Western blot showing reduced Ran protein levels after TDP-43 knockdown. (D) Quantification of (C). n = 9 wells/group, ***, P < 0.001, Student’s t test; 2 independent experiments). (E) Ran mRNA expression is reduced in aged Grn KO retinas. Q-PCR results from homogenized whole retinas from 10–12-mo-old mice shown. n = 15–16 mice/genotype; *, P = 0.014; Student’s t test; 2 independent experiments. Bars, 10 µm. (F–G) Ran is necessary for nuclear localization of TDP-43. (F) Representative images showing subcellular localization of TDP-43 in cortical neurons cotransfected with TDP-43-GFP and either empty vector, mCherry-Ran, mCherry-RanQ69L, or mCherry-RanT24N. TDP-43-GFP is present in the nuclei of neurons transfected with mCherry and mCherry-Ran, but is significantly reduced in nuclei of neurons transfected with either of the Ran mutants (arrowheads, dashed lines). (G) Quantification of the ratios of nuclear/cytoplasmic TDP-43-GFP. n = 21 cells/transfection; ***, P < 0.001, one-way ANOVA with Tukey’s post-hoc analysis; 2 independent experiments. (H–I) N2A cells were transfected with siRNA against Grn. Levels of Ran (H) and TDP-43 (I) were quantified via Western blot 7 d after transfection. n = 6 wells/group; **, P = 0.002 (TDP-43); **, P = 0.006 (Ran); 2 independent experiments. (J) Living wild-type or Grn KO primary neurons transfected with GFP + empty vector (control) or GFP + Ran were imaged longitudinally by automated microscopy at 24–48-h intervals for 7–9 d. Kaplan-Meir survival analysis was used to create cumulative risk of death functions for each population of transfected neurons. ***, P < 0.001 (log-rank test); n = 423 neurons (WT Ctrl), 518 neurons (KO Ctrl), 427 neurons (WT Ran), and 463 neurons (KO Ran); 3 independent experiments pooled. (K) Primary cortical neurons from wild-type or Grn KO mice were transduced with AAV-GFP (control) or AAV-GFP-P2A-Ran. 1 wk later, neurons were fixed and processed for TDP-43 immunostaining. Nuclear TDP-43 levels were quantified via Volocity. n = 101–478 cells imaged from 6–12 wells of a 96-well dish; *, P < 0.05 (mixed-effects multivariate linear regression model); 3 independent experiments. Means ± SEM shown (B, D, E, G–I, and K).

