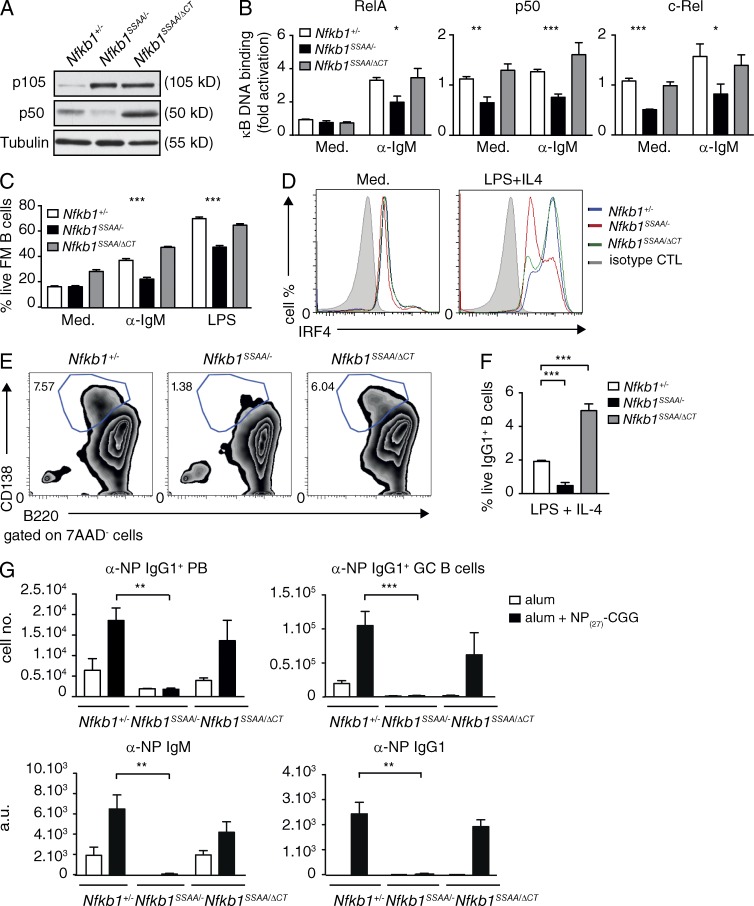
Figure 9.
Increasing p50 levels overcomes the inhibitory effect of Nfkb1SSAA mutation on FM B cell function. (A) Lysates of purified splenic FM B cells were immunoblotted. (B) Binding of the indicated Rel subunits to an NF-κB oligonucleotide was determined by ELISA (mean ± SEM). (C) The fractions of live FM B cells were determined as described in Fig. 5 C (mean ± SEM). (D) Intracellular IRF4 in live purified FM B cells ± LPS and IL-4 (40 h) was quantified by flow cytometry. (E) Plasma cell differentiation was monitored as in Fig. 8 C. (F) Purified FM B cells were stimulated with LPS and IL-4 for 3 d. The fractions of IgG1+ live B cells (B220+7AAD−) were determined by flow cytometry (±SEM). (G) Mixed radiation chimeras were made as in Fig. 2. Naive B (B220+, IgM+) cells and αNP+ IgG1+ plasmablasts (PB) and GC B cells were quantified by flow cytometry (mean absolute number ± SEM) 7 and 14 d after NP27-CGG immunization, respectively. α-NP IgM and IgG1 serum antibody levels were quantified by ELISA (mean ± SEM) 14 d after NP27-CGG immunization. All results are representative of three independent experiments (4–5 mice per genotype each). *, P < 0.05; **, P < 0.01; ***, P < 0.001.

