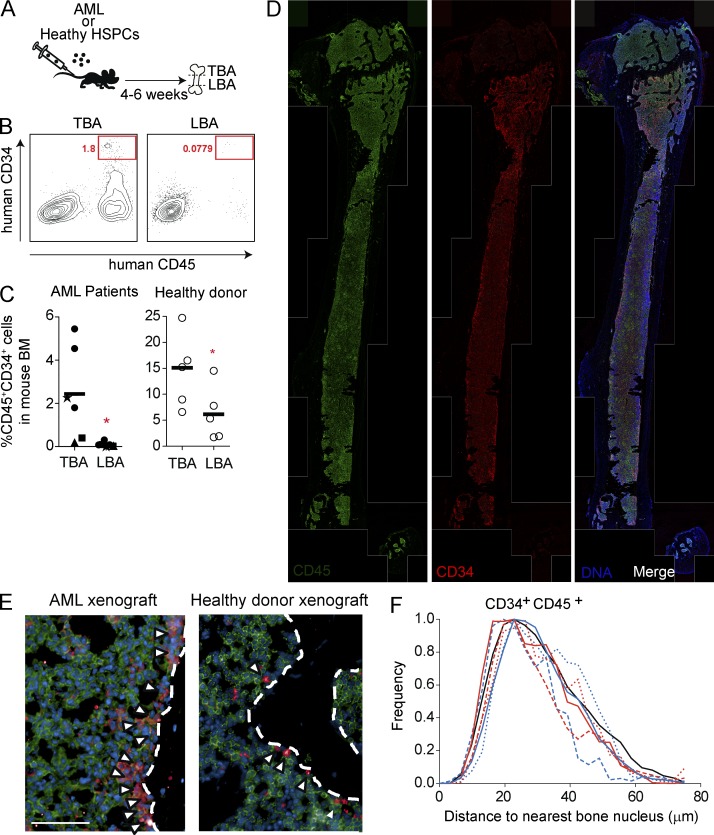
Figure 1.
Healthy and leukemic human CD34+ cells spatially overlap within the BM cavity. (A) Experimental design to study the location of healthy or leukemic human hematopoietic cells within the TBA and LBA of xenografted mouse femurs. (B) Representative flow cytometry plots showing human CD45+CD34+ AML cells within TBA and LBA regions. (C) Scatter plots showing the TBA- and LBA-specific frequencies of human CD45+CD34+ cells derived from AML patients or normal human donors. Each data point represents an individual mouse, and each symbol represents an independent primary human sample. *, P < 0.05, paired Student’s t test. (D) Representative whole-bone section images of AML-engrafted mouse femurs immunostained with human-specific CD45 and CD34. Images have been montaged from 82 individual fields. Bar, 1 mm. (E) Representative high magnification images of AML or healthy donor-engrafted mouse femurs immunostained with human-specific CD45 and CD34. Dotted lines indicate the endosteal boundary. Bar, 50 µm. (F) Proximity distribution of healthy or leukemic human CD45+CD34+ cells relative to the nearest bone nucleus. Black line indicates the distribution of CB CD45+CD34+ cells (averaged across 4 replicates), and each colored line represents an independent AML-engrafted femur. Each color represents a different primary human AML sample. P ≥ 0.20 when comparing AML CD45+CD34+ versus CB CD45+CD34+ distributions (Chi square).

