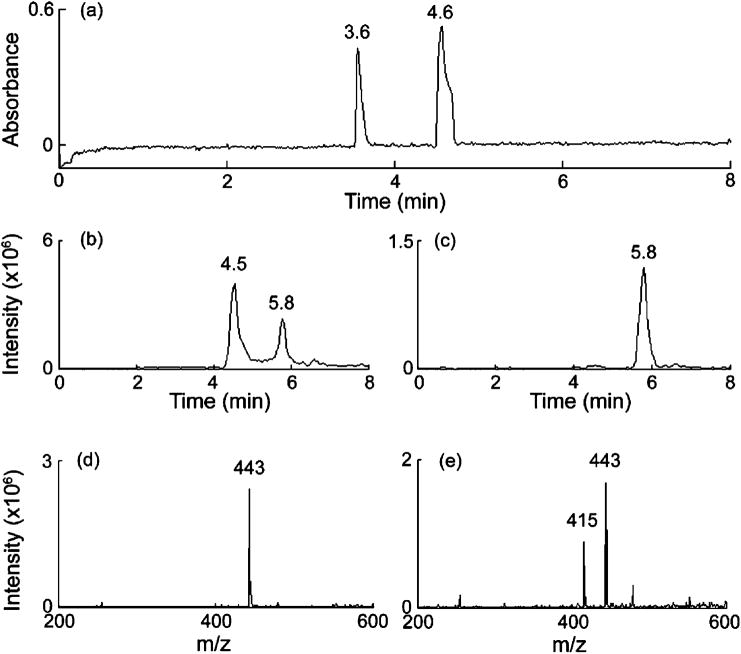
Figure 2.
CE separation of a mixture of three rhodamine dyes: (a) electropherogram as measured by UV–vis; (b) ion chromatogram for m/z 443; (c) ion chromatogram for m/z 415; (d) mass spectrum for a retention time of 4.5 min; and (e) mass spectrum for a retention time of 5.8 min. The selected retention times correspond to the peaks in the electropherogram.

