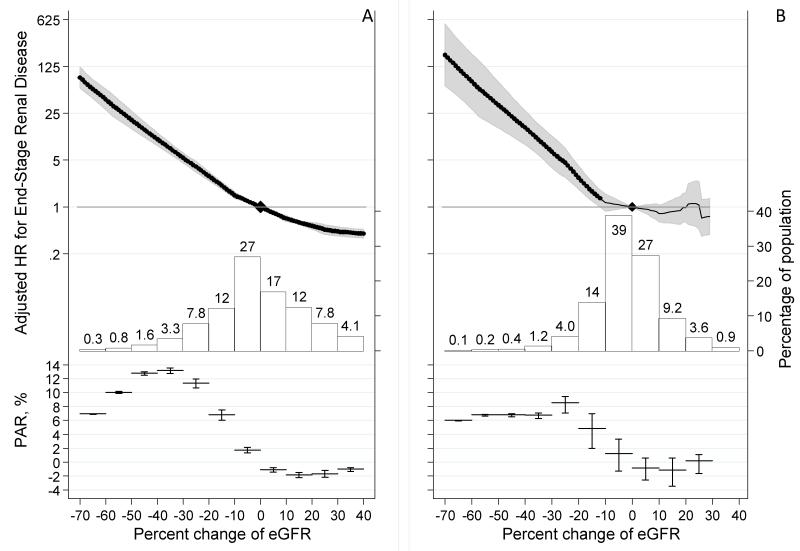
Figure 1.
Adjusted hazard ratio of end-stage renal disease associated with percent change in eGFR during a 2-year baseline period in eGFR<60 ml/min/1.73m2 (A) and eGFR≥60 ml/min/1.73m2 (B) and a histogram of the percent change in eGFR as well as approximate percent population attributable risk of end-stage renal disease. Values trimmed at <−70% change (0.22% and 0.055% of the study population in eGFR <60 and ≥60 ml/min/1.73m2, respectively) and >40% change (5.9% and 0.51% of the population in eGFR <60 and ≥60 ml/min/1.73m2, respectively).

