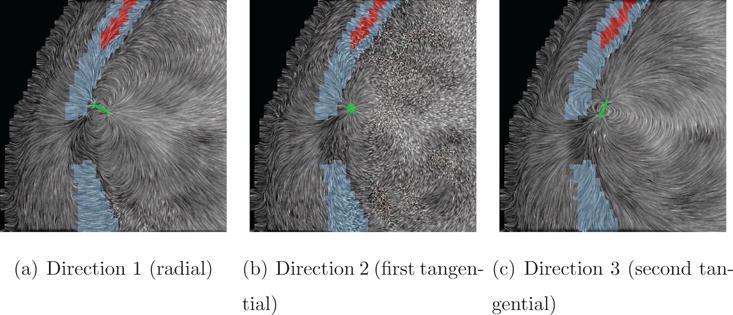
Figure 12. Line Integral Convolution (LIC) for Skull-Hole-Model.

LIC images on a coronal slice through the hole combined with the electric fields for all three source orientations in the Skull-Hole-Model. Small differences in current flow between the source orientations can be seen. However, a direct quantitative comparison is not reasonably possible with LIC. The green bar in each image indicates the source orientation and position. The soft bone tissue is colored in red, the hard bone tissue in blue, and the remaining head tissues in gray.
