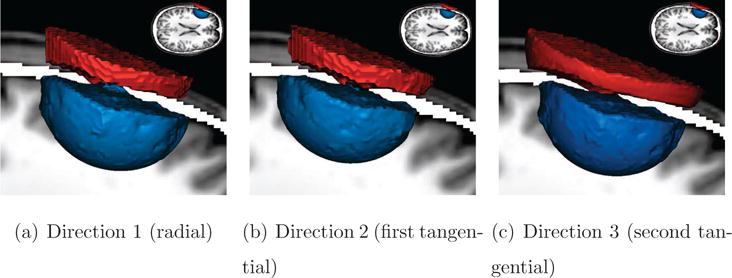
Figure 2. Isosurface renderings for Skull-Hole-Model.

These isosurfaces show, for each source direction, the potential differences (red for +0.2 μV; blue for −0.2 μV) between the Skull-Hole-Model and the reference model. For the positions and orientations of the dipoles, see Figure 12. These surfaces denote the border between the volume with an absolute difference of more than 0.2 μV on the inside and less than 0.2 μV on the outside. Directly comparing the colormaps of the reference field and the skull-hole fields does not allow a quantitative rating of differences between the two fields. Using the difference field instead unveils the structural difference caused by the skull-hole very explicitly. The images demonstrate that the influence of the skull hole is different (more wide-spread) for the second tangential source orientation (Direction 3). It is clearly shown that the skull-hole only influences the area around the hole and that the difference of reference model and Skull-Hole-Model on the remaining field is rather low.
