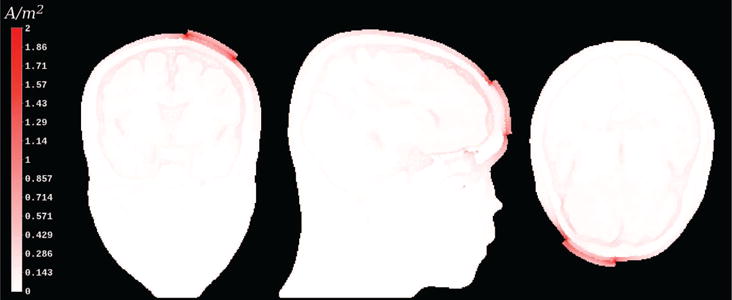
Figure 3. Current density magnitude plot for tDCS example on cutting plane.

An coronal, sagittal, and axial view of the volume conductor, where current density magnitudes (white-to-red colormap) are mapped. High current density concentrations are present at the electrode sponge-scalp boundaries as well as in CSF. Although the current density around the electrode sponge-scalp boundaries was maximally up to 4.2 A/m2, we have chosen a windowing interval of [0,2] A/m2. This way, we are able to show the rapidly decreasing current density in vicinity of the sponge-scalp boundaries, which, otherwise, would not be seen as their value would be mapped to a nearly white color.
