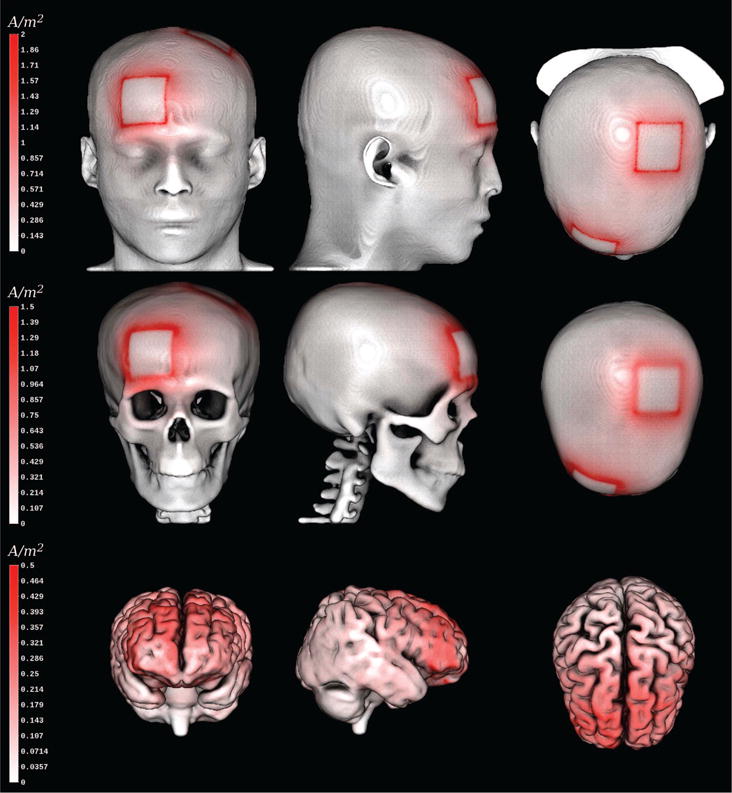
Figure 4. Current density magnitude plot for tDCS example on material boundaries.

Current density magnitude (white-to-red colormap) computed for a standard tDCS electrode setting displayed on tissue boundaries: scalp ([0, 2] A/m2), skull ([0, 1.5] A/m2), and brain surface ([0, 0.5] A/m2). We have used different windowing intervals for each tissue boundary to cope with the rapidly decreasing current density. This way, we avoid that the maxima on the skin influence the coloring on inner tissues. It can be seen that the conductivity profile of the modeled materials has different effects on the current density distribution.
