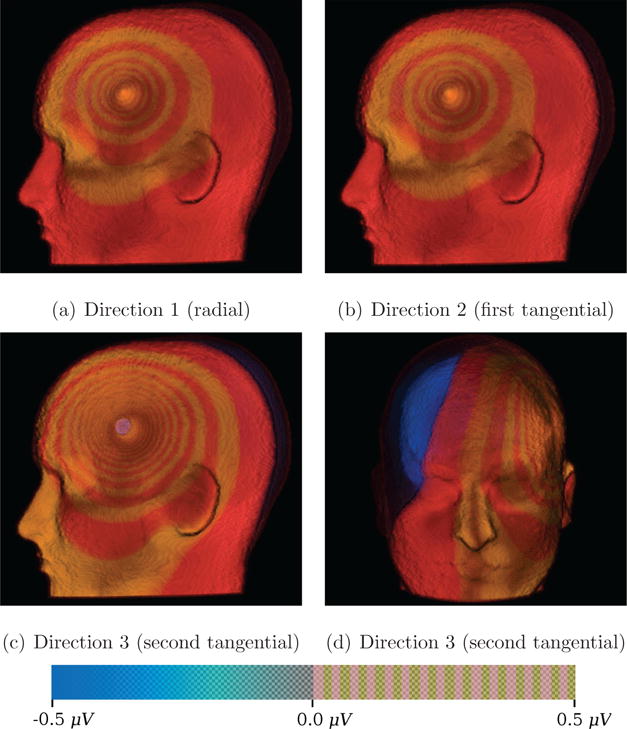
Figure 5. Direct Volume Rendering (DVR) for Skull-Hole-Model.

DVR for the potential difference fields for each source orientation in the Skull-Hole-Model. As Figure 2 indicated, the skull hole has the strongest influence on the field simulated from the second tangential direction. The used transfer-function shows the spreading potential difference between the Skull-Hole-Model data and the corresponding reference field. The transfer function maps negative potential differences to blue and positive differences up to 0.5 μV to a color pattern switching from red to yellow every 0.033 μV. This way, the spreading structure can be visualized in an intuitive way using direct volume rendering and is conceptually similar to isolines but has the advantage of also showing the spatial extend of intervals. For the positions and orientations of the dipoles, see Figure 12.
