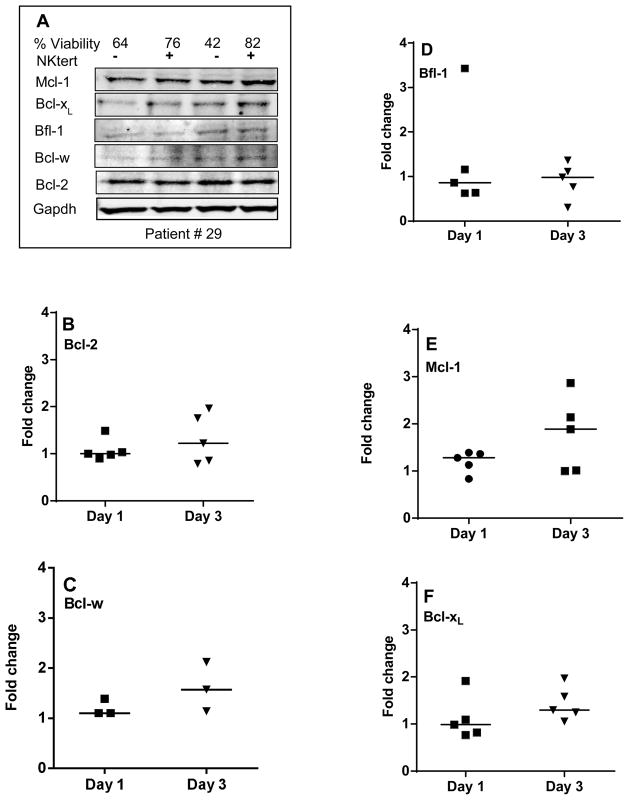
Figure 5. Comparison of protein expression of Bcl-2 family anti-apoptotic members in CLL cells between suspension cultures and stroma co-cultures (A–F).
CLL lymphocytes were incubated with NKTert stromal cell line at different time periods (day 1 and day 3) and the individual protein levels of Bcl-2 family anti-apoptotic members were determined by immunoblotting experiments. One representative patient data for a panel of anti-apoptotic proteins (A) and quantitative analysis of all the samples evaluated for anti-apoptotic proteins is provided (B–F). Each symbol on the graph represents fold change in protein expression with respect to that after stromal co-incubations, which is normalized to respective protein levels of control samples. One sample t test statistical analysis was performed.

