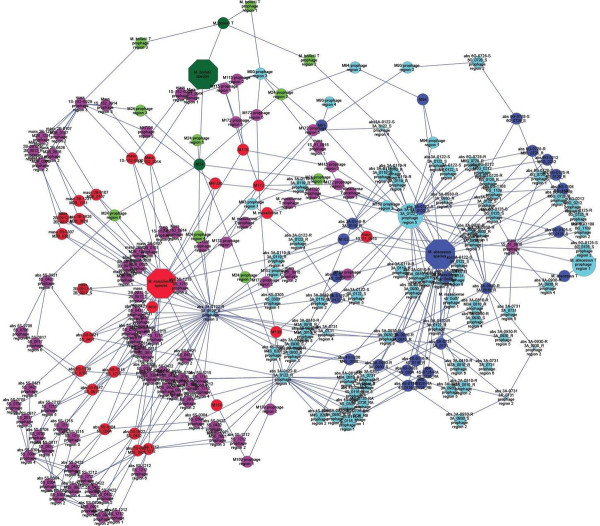
Figure 2.

Interacting Map based on M. abscessus prophage region homology. Blue: M. abscessus species. Red: M. massiliense species. Green: M. bolletii species. The nodes represent the M. abscessus prophage regions. The node size correlates to the size of the M. abscessus prophage regions. The homologous regions were connected with edges.
