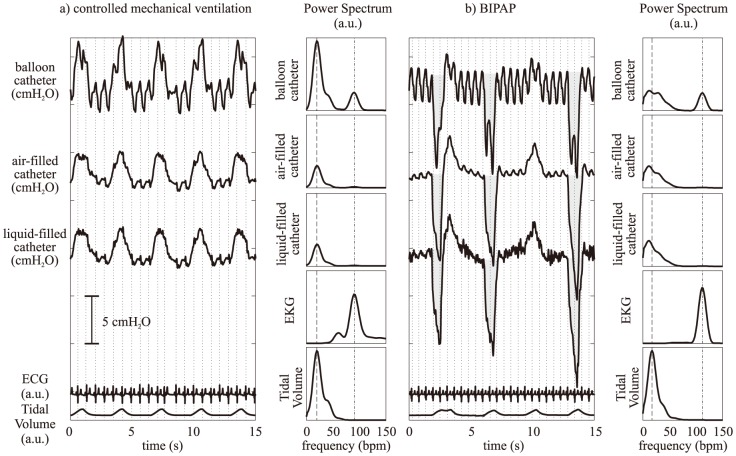
Figure 2. Representative esophageal pressure measurement tracings during a) controlled mechanical ventilation and b) biphasic positive airway pressure (BIPAP) ventilation with spontaneous breathing (note: offsets between the tracings are just for pictorial representation).
The balloon catheter tracings show large oscillations that are coherent with the heart-beats occurrences in the EKG (the dotted vertical lines represent the occurrence of the R-peaks of the EKG, i.e. ventricular contraction). To the right side of the tracings the power spectra of each esophageal pressure signal is shown, disclosing that the largest amount of the power is concentrated at frequencies compatible with the respiratory spectrum (dashed line represents the average respiratory rate). Interestingly, only the balloon catheter presents a peak of considerable power at frequencies compatible with the EKG spectrum (the dash-dot lines represent the average heart rate). The pressure-time product (PTP) is graphically represented by the gray areas in panel b): in the balloon tracings it is evident that cardiogenic noise affects the shape of the area, modifying the estimated value of PTP.

