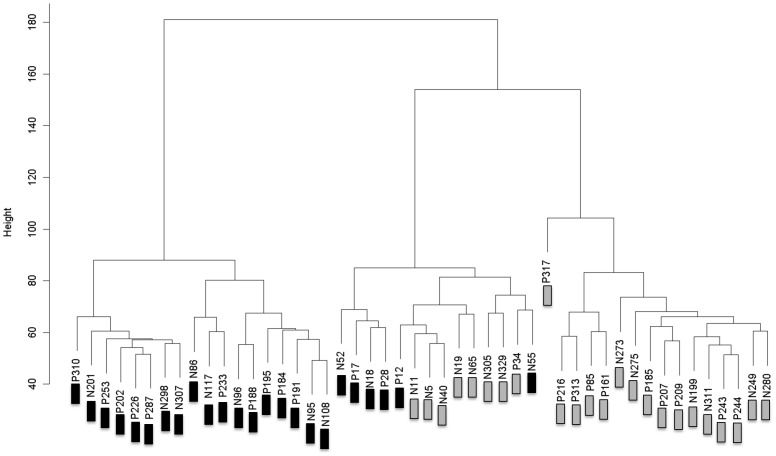
Figure 1. Hierarchical Clustering of all DNA Methylation Data.
Samples marked with “P” and “N” represents “normal” and “preeclampsia” samples respectively. Samples marked with black and grey boxes are from pregnancies in which the fetus was male and female respectively. Data points from all chromosomes were included.

