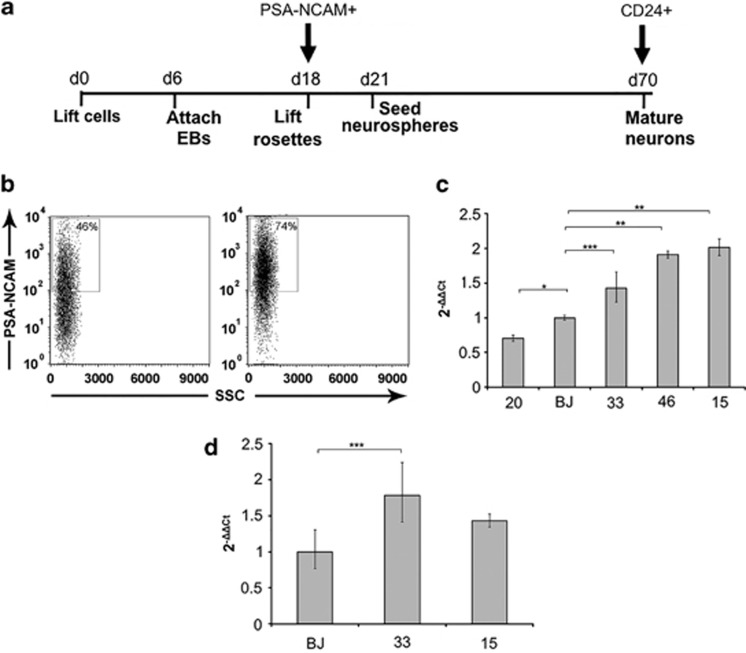
Figure 2.
(a) Overview of the neuronal differentiation protocol showing the timing of specific passages expressed in days respect to day 0 (d0) defined as the first day of the protocol. The arrows indicate the day at which neuronal precursors (PSA-NCAM+) or neurons (CD24+) were sorted for expression analysis. (b) FACS analysis of differentiating cultures before sorting (left) and after sorting with anti-PSA-NCAM microbeads (right) showing a significant enrichment in positive cells. The x axis shows SSC (side scatter), and the y axis shows fluorescence intensity. (c) GRID1 expression analysis in PSA-NCAM+ NPCs (day 18) mRNA derived from neuronal differentiation of CDKL5 (20, 46, and 33)- and MECP2 ( 15)-mutated clones (for clone identification see Figure 1 legend). (d) Expression analysis in mature neurons at day 70 of differentiation protocol sorted with anti-CD24 microbeads. The y axis in (c) and (d) shows 2−ΔΔCt values (±SD). *P≤0.01; **P≤0.0001; ***P≤0.05.

