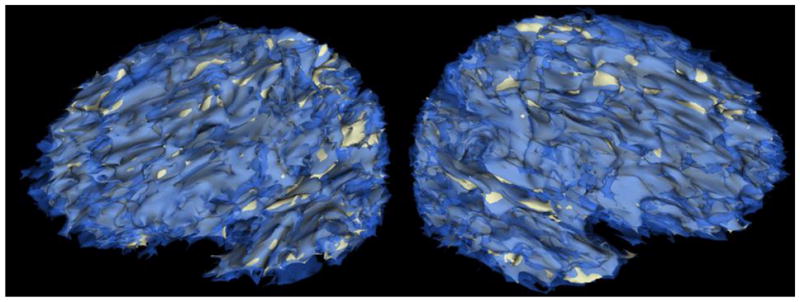
FIG. 1.

Three-dimensional representation of atrophy in the left and right hemisphere (left and right images, respectively) derived from co-registered acute (transparent blue) and chronic (grey) magnetic resonance images from a study participant. Note that areas of blue over grey indicate atrophy. This participant, like most of our participants, evidenced gross cortical atrophy. Images represent total atrophy, not just that due to early metabolic crisis.
