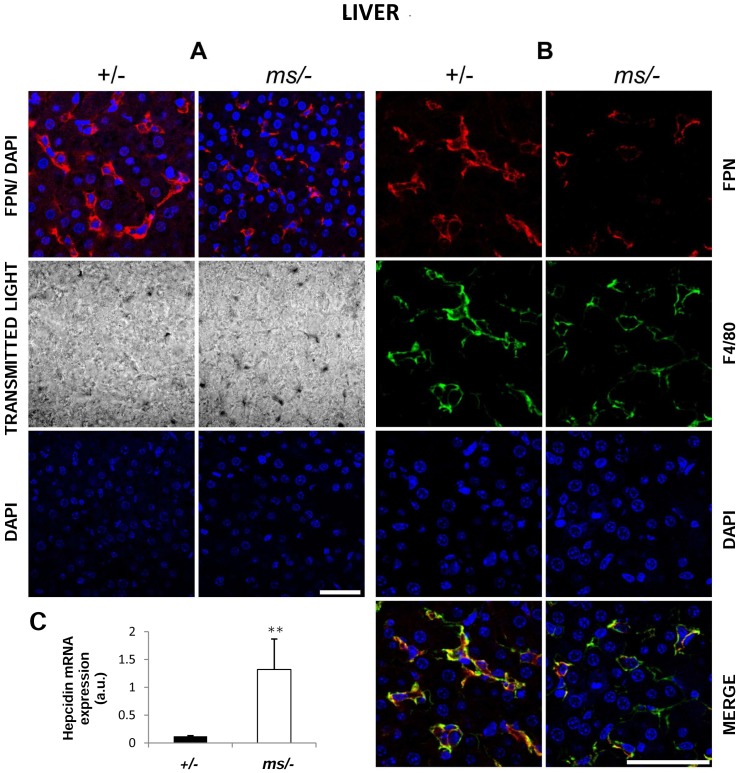
Figure 5. Correlation between decreased ferroportin (Fpn) protein level and increased hepcidin (Hepc) mRNA expression in the liver of ms/− males.
(A) Immunofluorescent staining of Fpn in +/− and ms/− males. top panel Livers analyzed by confocal microscopy. middle panel Tissue morphology observed in transmitted light. bottom panel To confirm the specificity of Fpn detection, liver sections of +/− and ms/− males were incubated with only the secondary antibody. No Fpn staining was detected in these negative controls. Nuclei were counterstained with DAPI. Bars correspond to 50 µm. (B) Colocalization (bottom panel) of Fpn (red channel) and F4/80, a macrophage marker (green channel) in liver from +/− and ms/− males analyzed by confocal microscopy. Nuclei were counterstained with DAPI. Bars correspond to 50 µm. (C) Real-time quantitative PCR analysis of hepatic Hepc mRNA expression in +/− and ms/− males. The histogram displays Hepc mRNA levels in arbitrary units (means ± S.D., n = 6). Significant difference is indicated (** – P<0.01).

