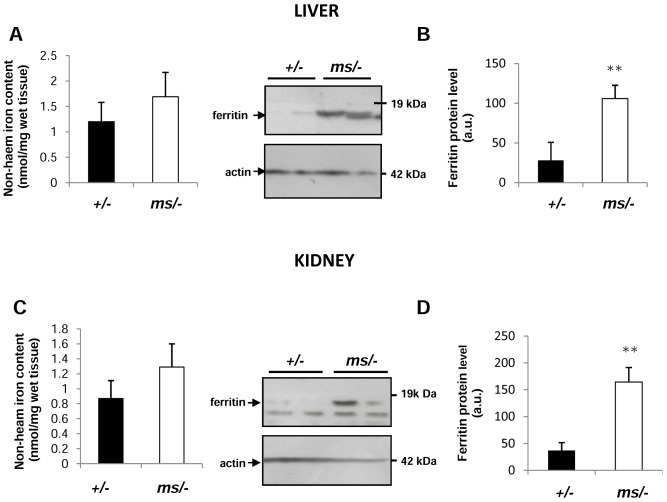
Figure 6. Hepatic and renal iron status in control (+/−) and mutant (ms/−) mice.
Non-haem hepatic (A) and renal (C) iron content was measured as described in the Experimental section. Values are expressed as the means ± S.D. for both liver and kidney samples obtained from 15 mice of each genotype. L-ferritin levels in hepatic (B) and renal (D) cytosolic protein extracts (50 µg/lane) were assessed by western blot analysis left-hand panels. The blots were reprobed with polyclonal anti-human actin antibody as a loading control. (B) and (D) right-hand panels Immunolabelled ferritin bands from four mice were quantified using a Molecular Imager and ferritin protein levels (means ± S.D.) are plotted in arbitrary units. ** – P<0.01.

