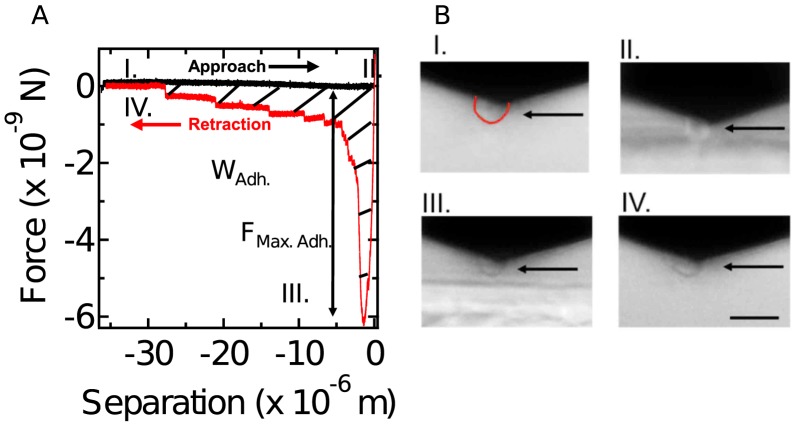
Figure 1. Single Cell adhesion Force Spectroscopy assay.
A. Force was measured from bending of the cantilever and a typical force-separation curve is shown for an approach-retraction cycle highlighting the two assessed parameters: maximum adhesion force FMax.Adh. and the work of adhesion WAdh. (integral of the hatched area). I–IV refers to the four panels shown under B. B. Side view of a cycle of approach and retraction of a cell attached to a cantilever. Panels I and II: A cell can be seen hanging below the cantilever as it approaches the glass slide (light colored surface, Dictyostelium contour in red under I). Panels III and IV: The cell can be seen to remain on the cantilever as it is retracted and it maintains a rounded shape. Arrows highlight cell position. Scale bar is 20 µm.

