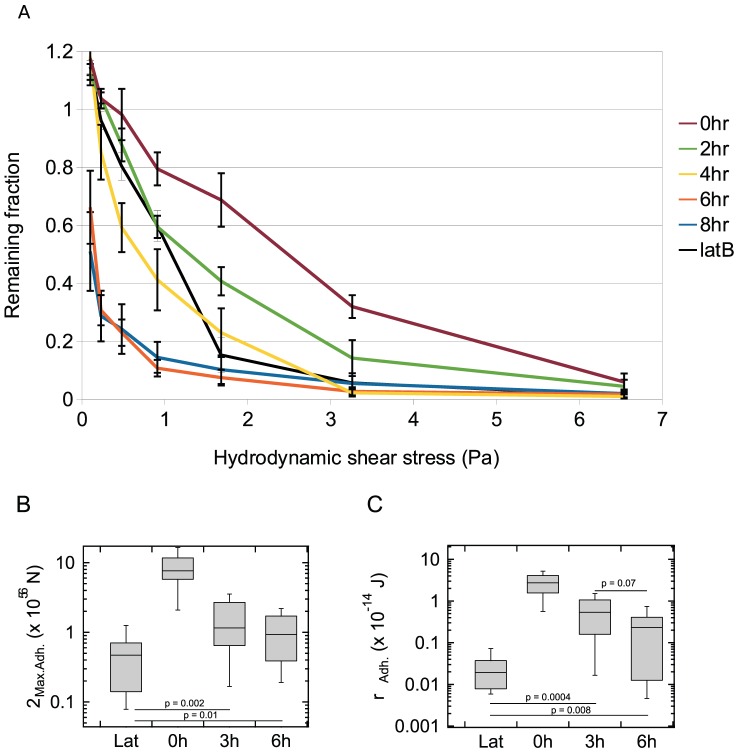
Figure 2. Decrease in adhesion during early development of Dictyostelium discoideum.
A. Microfluidic assay: the remaining fraction of cells after 40 minutes in chambers 2–8 is shown for cells that had developed for varying lengths of time. latB refers to 0 hr cells that were treated with 10 µM latrunculin B for 30 minutes to disrupt the actin cytoskeleton and assayed in the presence of the drug. Average of at least 5 independent experiments. The bars indicate the S.E.M. B. Single cell adhesion force assay of cells during early development. Box plot of the distribution of maximum adhesion forces FMax.Adh of individual single cells, where the bottom and the top of the box represents the first and the third quartiles, and the band corresponds to the median. Cells were developed for 0 h (n = 33), 3 h (n = 47), 6 hr (n = 31). Top whiskers are at 90% and bottom whiskers are at 10% of the distribution. Latrunculin B treated 0 hr cells (Lat) (n = 27) were assayed in the presence of 10 µM latrunculin B to disrupt the actin cytoskeleton. C. Work of adhesion WAdh. measured for the same cells. Nonparametric statistical hypothesis test Wilcoxon rank-sum test were used for significance.

