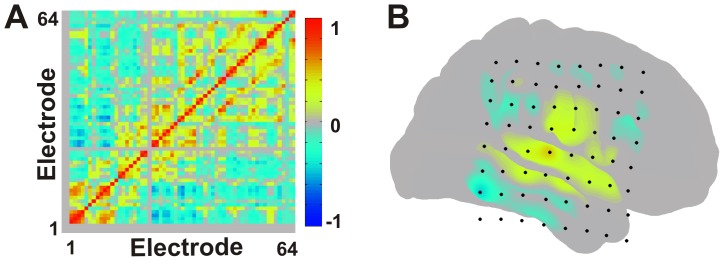
Figure 2. Correlation analysis.

(A) Adjacency matrix depicting correlation coefficients between all electrodes across an entire 20 minute epoch (B) Cortical surface rendering of seizure network correlation structure when selecting the seizure focus seed for a single patient (Patient 2). Multiple comparison correction was performed using the false discovery rate method.
