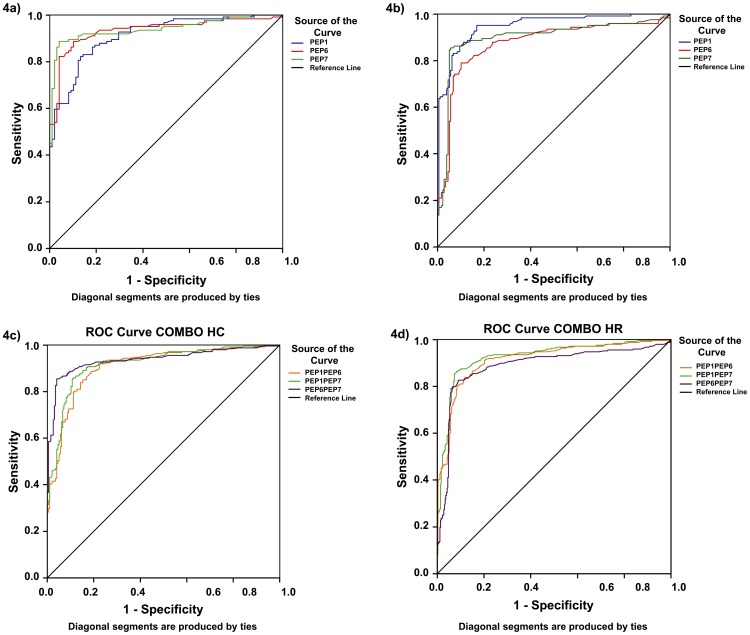
Figure 4. ROC curves representing the performance of P1, P6 and P7 BSA-peptide conjugates on lateral flow format.
(A) ROC curves for reactivity of individual BSA-peptide conjugates with sera from healthy subjects and all smear-positive TB patients. (B) ROC curves for reactivity of individual BSA-peptide conjugates with sera from close/household contacts/NTBLD patients/HIV+TB- patients as reference standard, and all smear-positive TB patients. (C) ROC curves representing the additive performance of P1+P6, P1+P7 and P6+P7 conjugates for reactivity with sera from all smear-positive TB patients and healthy PPD-/PPD+/PPD-unknown subjects as reference standard. (D) ROC curves representing the additive performance of P1+P6, P1+P7 and P6+P7 conjugates for reactivity with sera from all smear-positive TB patients and from close/household contacts/NTBLD patients/HIV+TB- patients as reference standard.

