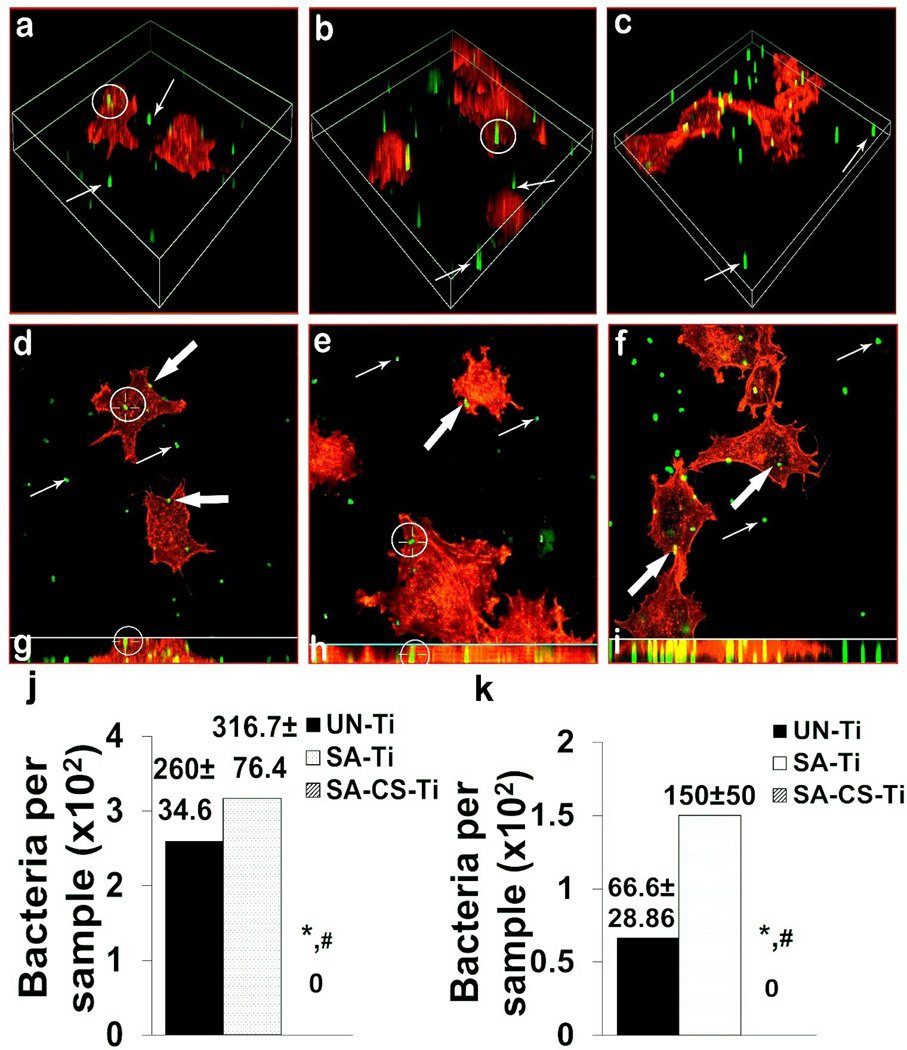
Figure 2.
Antimicrobial activity study. (a–c) Confocal microscopy 3D view was used to observe representative internalized bacteria (i-bacteria, white circled) on UN-Ti (a), SA-Ti (b) and SA-CS-Ti (c). (d–f) X–Y sections of representative images that showed the intracellular position of the same i-bacteria (white circled) on UN-Ti (d), SA-Ti (e) and SA-CS-Ti (f). (g–i) Vertical views obtained by combining the series of X–Y scans taken along the Z-axis at maximum intensity projection mode to show the intracellular position of the same i-bacteria (white circled) on UN-Ti (g), SA-Ti (h) and SA-CS-Ti (i). (j) Quantification of internalized/invaded bacteria into the osteoblasts like cells on different materials (n=4). (k) Antibiotic susceptibility of bacteria on different samples (n=4). (*) denotes a significant difference (p<0.05) between the number of bacteria internalized on UN-Ti and SA-CS-Ti and (#) denotes significant difference (P<0.05) between UN-Ti and SA-CS-Ti.

