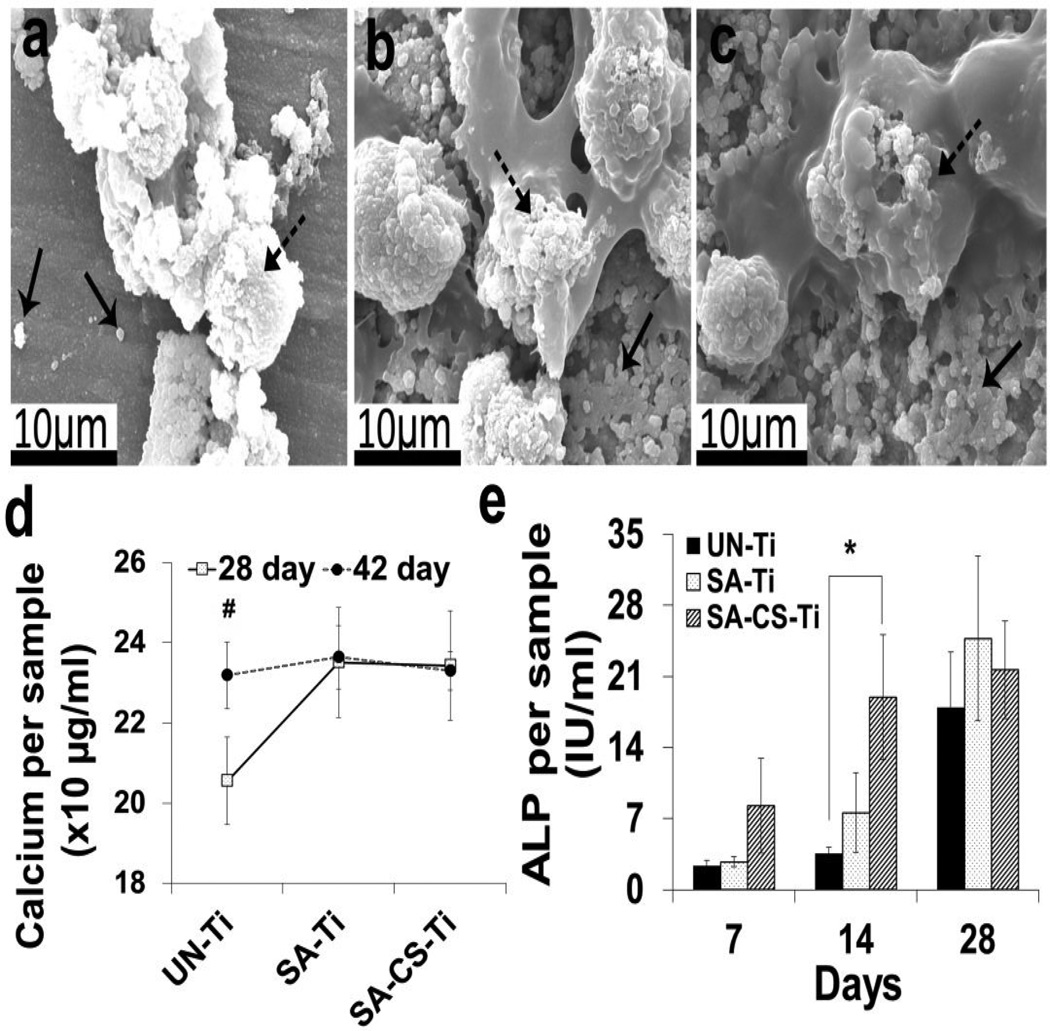
Figure 5.
Cell maturation and differentiation study. (a–c) SEM images of mineralized matrix deposition on UN-Ti (a), SA-Ti (b) and SA-CS-Ti (c) on Day 28. Solid arrows show the mineralized matrices deposited on the sample surfaces and dashed arrows show cells on the sample surfaces. (d) Quantitative representation of calcium deposition on UN-Ti, SA-Ti and SA-CS-Ti on Days 28 and 42 (n=4). (#) denotes significant increase in the calcium deposition (p<0.05) from Day 28 to Day 42 within the same experimental groups. (e)ALP activity on UN-Ti, SA-Ti and SA-CS-Ti on Days 7, 14 and 28 (n=4). (*) denotes significant difference (p<0.05) compared with untreated titanium at respective time points.

