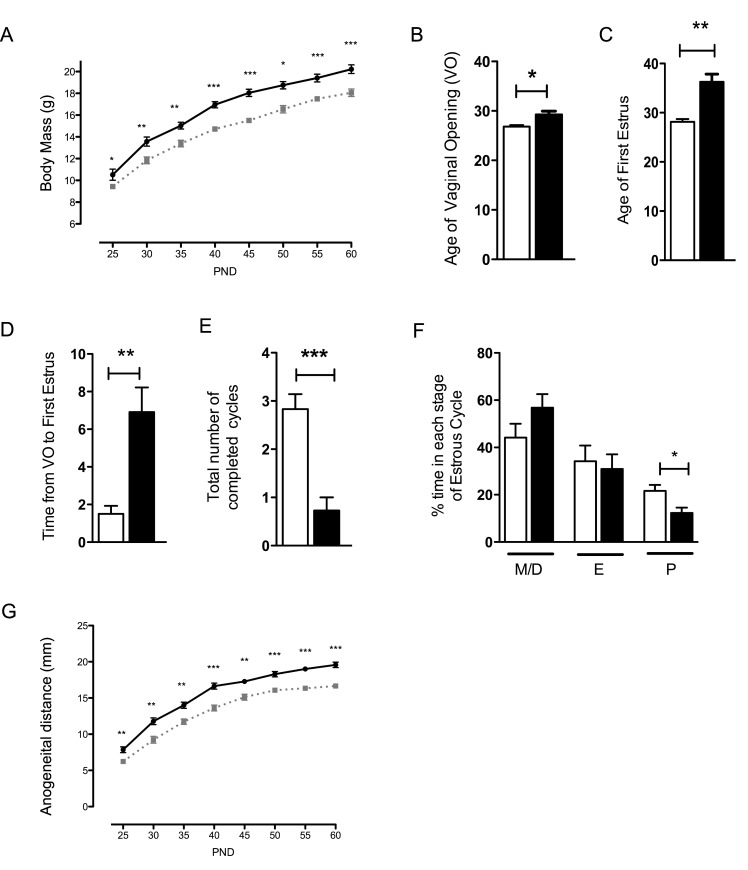
Figure 4. Female Nes-cre;Dmxl2 –/wt mice displayed delayed puberty and were infertile.
(A) Postnatal growth curve of female nes-Cre;Dmxl2 –/wt mice (black line, Dmxl2lox/wt; hatched gray line, nes-Cre;Dmxl2 –/wt). (B and C) VO and first estrus occurred significantly later in female nes-Cre;Dmxl2 –/wt mice than in their WT littermates. (D) The interval from VO to first estrus was significantly longer in female nes-Cre;Dmxl2 –/wt mice than in WT mice, suggesting a defect in maturation of the HPG axis. (E) Very few complete estrous cycles were observed in female nes-Cre;Dmxl2 –/wt mice. (F) Female nes-Cre;Dmxl2 –/wt spent less time in high estradiol concentration (M, miestrus; E, estrus; D, diestrus; P, proestrus). (G) A significant difference in AGD was observed between male nes-Cre;Dmxl2 –/wt mice and their WT littermates. Black line, Dmxl2lox/wt; hatched gray line, nes-Cre;Dmxl2 -/wt. White bars, Dmxl2lox/wt. Black bars, nes-Cre;Dmxl2 –/wt. Numerical data used to generate graphs 4B, 4C, 4D, 4E, 4F, or graphs 4A, 4G may be found in Table S5 and Table S6, respectively. Error bars are SEM. *p<0.05, **p<0.01, ***p<0.001.

